

Answered step by step
Verified Expert Solution
Question
1 Approved Answer
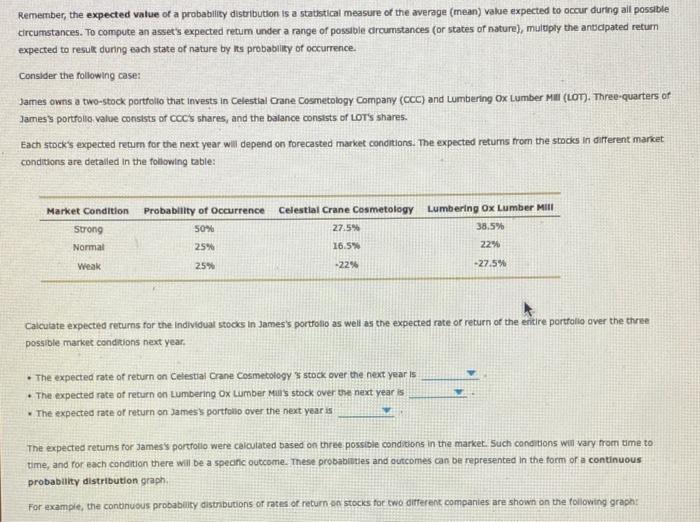
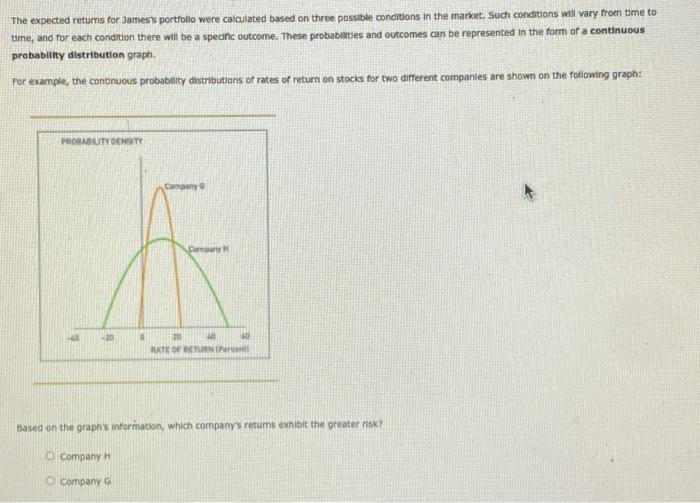
12.38% | 10.52% | 16.71% | 14.86% 22.16% | 20.19% | 11.62% | 17.87% 11.69% | 18.56% | 16.50% | 13.75% Remember, the expected value
12.38% | 10.52% | 16.71% | 14.86%
22.16% | 20.19% | 11.62% | 17.87%
11.69% | 18.56% | 16.50% | 13.75%
Step by Step Solution
There are 3 Steps involved in it
Step: 1

Get Instant Access to Expert-Tailored Solutions
See step-by-step solutions with expert insights and AI powered tools for academic success
Step: 2

Step: 3
Ace Your Homework with AI
Get the answers you need in no time with our AI-driven, step-by-step assistance
Get Started
Essentials Of Health Care Finance
Authors: William O. Cleverley, James O. Cleverley, Paula H. Song
7th Edition
0763789291, 978-0763789299