

Question: 12:38 4 Assignment Details MTH 154-N41A: Quantitative Reasoning (SP21) MTH 154 Excel Project In this major project, you will create an Excel file and answer


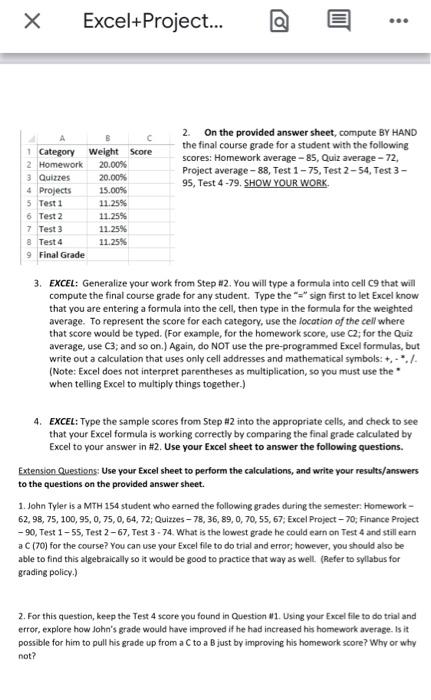
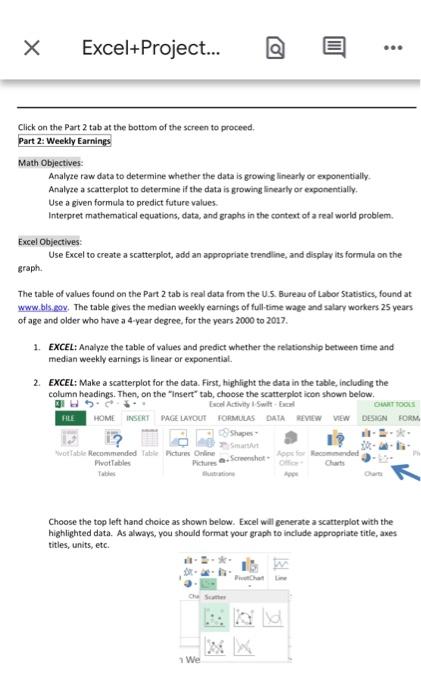
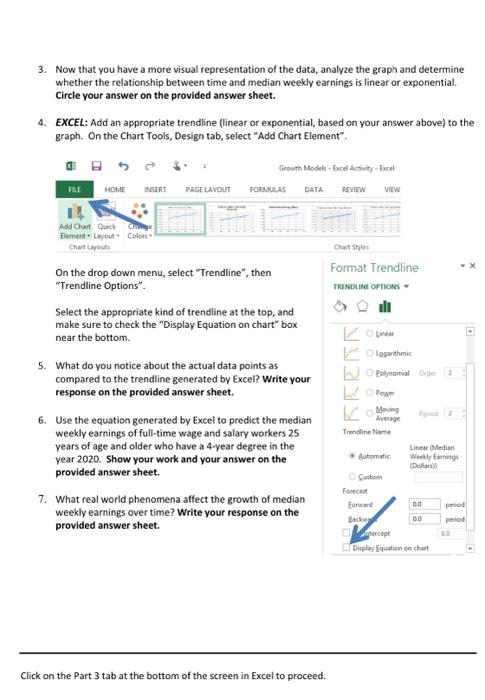
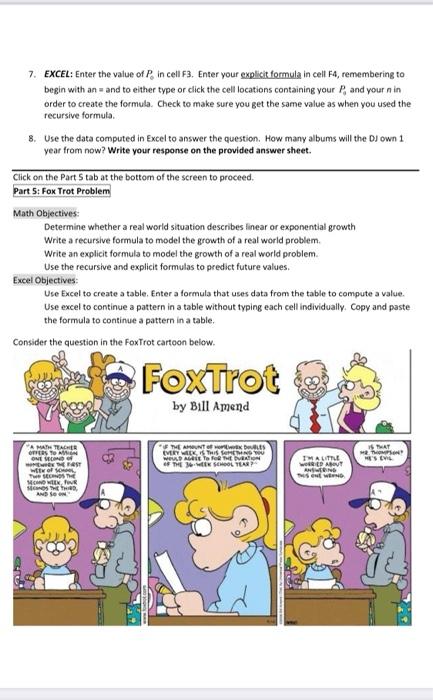
12:38 4 Assignment Details MTH 154-N41A: Quantitative Reasoning (SP21) MTH 154 Excel Project In this major project, you will create an Excel file and answer questions about linear and exponential growth. Part 1 Download the full version of Excel, if you haven't already, from the VCCS website. You will work through the project description. Download the Excel project base file. You will need to submit this. Download the Excel project answer sheet. You will also need to submit this, and may want to print it, or just write your answers down. e Part 11 Read and work your way through the project description. Be sure to complete all the steps in Excel Submit Assignment Part 11 Read and work your way through the project description. Be sure to complete all the steps in Excel and in the answer sheet. . 8 Assignment Guidelines You need to submit both the Excel file and a picture or scan of your completed answer sheet. Be sure to check your work using the rubric. This project is due on March 21. 11:03 3 X Excel+Project... a Name Excel Project READ ALL INSTRUCTIONS THOROUGHLY. Assignment: This project has five parts. Follow the steps for each part to modify the provided base Excel file with five tabs/sheets. Use the provided answer sheet to answer all of the question as you go along Save the excel file promptly and frequently so your work is not lost. Name the file using your last name and first initial, followed by the section number for your course (for example: Smith M03B). Submit both the answer sheet and your Excel file for grading Grading: This Excel project is one of two projects you will have in the Projects category of your course grade. You will be graded on the formatting/presentation of your Excel file, the accuracy of your Excel formulas and data, and your written responses to questions about the process and results. Due dates are announced in class. Begin by downloading the "Excel Project-base file.xlsx" file from Course Materials in our course in Blackboard. Open the file, click on the first tab along the bottom of the screen labeled "Part 1 - Weighted Average", and proceed to part 1 below. Part 1: Weighted Average Math Objective: Create a formula that computes the weighted average for this class, and use the formula to make predictions about course grades. (NOTE: DO NOT use the pre-programmed Excel formula commands; write your own mathematical formula.) Excel Objectives: Use Excel to create a table. Create a formula that uses data from the table to compute a value 1. EXCEL: In your copy of the Excel Project - base file.xlsx, make sure you are on the first tab along the bottom of the screen labeled "Part 1 - Weighted Average". Create a table (see below) listing the grade categories that will be used to compute your grade for this class, along with the weight for each category. Include a column where you can type in the score eamed for that category by the student. (NOTE: Make all of your tables clear and neat by using bold/underline type for the column headings and by resizing columns as needed. Recall that points are awarded for presentation) Excel+Project... ... 2. On the provided answer sheet, compute BY HAND the final course grade for a student with the following scores: Homework average - 85, Quiz average - 72, Project average - 88, Test 1 - 75, Test 2-54. Test 3 - 95, Test 4-79. SHOW YOUR WORK. .. 1 Category Weight Score 2 Homework 20.00% 3 Quizzes 20.00% 4 Projects 15.00% 5 Test 1 11.25% 6 Test 2 11.25% 7 Test 3 11.25% & Test 4 11.25% 9 Final Grade 3. EXCEL: Generalize your work from Step #2. You will type a formula into cell C9 that will compute the final course grade for any student. Type the "+" sign first to let Excel know that you are entering a formula into the cell, then type in the formula for the weighted average. To represent the score for each category, use the location of the cell where that score would be typed. (For example, for the homework score, use C2; for the Quiz average, use C3, and so on.) Again, do NOT use the pre-programmed Excel formulas, but write out a calculation that uses only cell addresses and mathematical symbols: +,-./. (Note: Excel does not interpret parentheses as multiplication, so you must use the when telling Excel to multiply things together.) 4. EXCEL: Type the sample scores from Step #2 into the appropriate cells, and check to see that your Excel formula is working correctly by comparing the final grade calculated by Excel to your answer in #2. Use your Excel sheet to answer the following questions. Extension Questions: Use your Excel sheet to perform the calculations, and write your results/answers to the questions on the provided answer sheet. 1.John Tyler is a MTH 154 student who earned the following grades during the semester: Homework - 62,98, 75, 100, 95, 0,75,0,64, 72, Quizzes - 78, 36, 89, 0,70,55, 67, Excel Project - 70, Finance Project -90, Test 1-55, Test 2-67, Test 3 - 74. What is the lowest grade he could earn on Test 4 and still earn aC (70) for the course? You can use your Excel file to do trial and error; however, you should also be able to find this algebraically so it would be good to practice that way as well. (Refer to syllabus for grading policy.) 2. For this question, keep the Test 4 score you found in Question 11. Using your Excel file to do trial and error, explore how John's grade would have improved if he had increased his homework average. Is it possible for him to pull his grade up from a to a B just by improving his homework score? Why or why not? Excel+Project... Click on the Part 2 tab at the bottom of the screen to proceed. Part 2: Weekly Earnings Math Objectives: Analyze raw data to determine whether the data is growing linearly or exponentially Analyze a scatterplot to determine if the data is growing linearly or exponentially Use a given formula to predict future values Interpret mathematical equations, data, and graphs in the context of a real world problem. Excel Objectives: Use Excel to create a scatterplot, add an appropriate trendline, and display its formula on the graph. The table of values found on the Part 2 tab is real data from the U.S. Bureau of Labor Statistics, found at www.bls.com. The table gives the median weekly earnings of full-time wage and salary workers 25 years of age and older who have a 4-year degree, for the years 2000 to 2017 1. EXCEL: Analyze the table of values and predict whether the relationship between time and median weekly earnings is linear or exponential 2. EXCEL: Make a scatterplot for the data. First, highlight the data in the table, including the column headings. Then, on the "Insert tab, choose the scatterplot icon shown below. HS Excel Active Suite FILE HOME INSERT PAGE LAYOUT FORMULAS DATASEVIEW VIEW DESIGN FORM Shapes wotlable Recommended Table Pictures Online Screenshot Koplo Recomended Plot Tables GURT TOOLS Choose the top left hand choice as shown below. Excel will generate a scatterplot with the highlighted data. As always, you should format your graph to include appropriate title, axes titles, units, etc. We 3. Now that you have a more visual representation of the data, analyze the graph and determine whether the relationship between time and median weekly earnings is linear or exponential. Circle your answer on the provided answer sheet. 4. EXCEL: Add an appropriate trendline (linear or exponential, based on your answer above) to the graph. On the Chart Tools, Design tab, select "Add Chart Element". Growth Model - Excel Activity - Excel FORMULAS DATA REVIEW VIEW FREE HOME INSERT PAGE LAYOUT Add Chart Quick Com Element Layout Color Chart Layouts Format Trendline TRENDLINE OPTIONS li On the drop down menu, select "Trendline", then "Trendline Options": Select the appropriate kind of trendline at the top, and make sure to check the "Display Equation on chart" box near the bottom 5. What do you notice about the actual data points as compared to the trendline generated by Excel? Write your response on the provided answer sheet. Logarthmic Polynomial Order LI Moving Average Trendline Name Automatic Linear Median Weekly Euning Dollar 6. Use the equation generated by Excel to predict the median weekly earnings of full-time wage and salary workers 25 years of age and older who have a 4-year degree in the year 2020. Show your work and your answer on the provided answer sheet 7. What real world phenomena affect the growth of median weekly earnings over time? Write your response on the provided answer sheet. Custom Forca forward 00 pod period tercept Display Equation on chart Click on the Part 3 tab at the bottom of the screen in Excel to proceed. Part 3: World Population Math Objectives: Analyze raw data to determine whether the data is growing linearly or exponentially Analyze a scatterplot to determine if the data is growing linearly or exponentially Use a given formula to predict future values. Interpret mathematical equations, data, and graphs in the context of a real world problem. Excel Objectives: Use Excel to create a scatterplot, add an appropriate trendine, and display its formula on the graph. The table of values found on the Part 3 tab is real estimated world populations data from the United States Census Bureau and is a compilation of data found in two different tables (pre- and post-1950) on www.census.gov 1. EXCEL: Analyze the first two columns in the table of values and predict whether the relationship between time and world population is linear or exponential. 2. EXCEL: Make a scatterplot for the data in the first two columns, year and population. Refer to your peers or the detailed instructions found in Part 2 if you need help. As always remember to format your graph to include appropriate title, axes titles, units, etc. 3. Now that you have a more visual representation of the data, analyze the graph and determine whether the relationship between time and world population is linear or exponential. Circle your answer on the provided answer sheet 4. EXCEL: Add an appropriate trendline (linear or exponential, based on your answer above) to the graph and display its equation. Refer to your peers or the detailed instructions found in Part 2 if you need help. 5. What do you notice about the actual data points as compared to the trendline generated by Excel? What discrepancies do you see? Write your response on the provided answer sheet. 6. Use the equation generated by Excel to predict the world population in the year 2020, and in the year 2050. When generating an exponential model, Excel uses the number "e" in the base of the formula. The value of e is approximately 2.71828. For your calculations, you can either use this approximate value, or use the exbutton on your calculator. Show your work and your answer on the provided answer sheet. **NOTE: Before assuming you must be wrong when obtaining your prediction for 2020 based on the exponential model created by Excel, go back to your discussion in #5 above and think about why this anomaly might have occurred. 7. What real world phenomena would affect world population growth over time? Write your response on the provided answer sheet. Click on the Activity 3 tab at the bottom of the screen in Excel to proceed. Part 4: Do's Albums Math Objectives: Determine whether a real world situation describes linear or exponential growth Write a recursive formula to model the growth of a real world problem Write an explicit formula to model the growth of a real world problem. Use the recursive and explicit formulas to predict future values Excel Objectives: Use Excel to create a table. Enter a formula that uses data from the table to compute a value. Use excel to continue a pattern in a table without typing each cell individually. Copy and paste the formula to continue a pattern in a table. A DJ buys 3 new albums every week to keep her collection current. She currently owns 300 albums How many albums will she own one year from now? 1. Reread the problem and determine whether the situation describes linear or exponential growth. Circle your answer on the provided answer sheet. 2. On the provided answer sheet, write a recursive formula for the number of albums the Dl has after n weeks. 3. EXCEL: You will use Excel to create a table that shows the total number of albums the DJ has each week. Enter her current (initial) number of albums in cell B3. 4. EXCEL: Column A will show the number of weeks from now. Rather than typing the numbers 1 through 52, highlight cells A3 through A6, then move the mouse onto the box on the bottom right hand corner of your highlighted block until it turns to a solid cross, +. Click the cross and pull down to the rows below in order to continue the pattern. This is a very useful feature of Excel 5. EXCEL: Column B will show the current number of albums. Click on cell B4, and type a formula that gives the number of albums the DJ owns 1 week later. (Remember to begin with an = sign to tell Excel that you are writing a formula.) In your formula, use the location of the cell containing the value that you want in order to refer to that value (don't just type the number) Once you have checked that your formula makes sense, highlight B4, click the bottom right hand corner (make sure it shows the solid cross, +), and drag down to continue the pattern to the rest of the cells. You can click on a different cell in Column B and see how the formula has changed. 6. While Excel makes things easier by allowing us to drag to continue a pattern, we still really didn't need to compute all of the data for weeks 1 through 51 if we actually only need to know about week 52. If we had instead come up with an explicit formula, we could have just filled in one row to get our answer. Reread the problem to determine P, and write an explicit formula for the number of albums the DJ has after n weeks on the provided answer sheet. 7. EXCEL: Enter the value of P, in cell F3. Enter your explicit formula in cell F4, remembering to begin with an - and to either type or click the cell locations containing your P, and your in order to create the formula. Check to make sure you get the same value as when you used the recursive formula 8. Use the data computed in Excel to answer the question. How many albums will the Down 1 year from now? Write your response on the provided answer sheet. Click on the Part S tab at the bottom of the screen to proceed. Part 5: Fox Trot Problem Math Objectives: Determine whether a real world situation describes linear or exponential growth Write a recursive formula to model the growth of a real world problem Write an explicit formula to model the growth of a real world problem. Use the recursive and explicit formulas to predict future values Excel Objectives Use Excel to create a table. Enter a formula that uses data from the table to compute a value. Use excel to continue a pattern in a table without typing each cell individually. Copy and paste the formula to continue a pattern in a table, Consider the question in the Foxtrot cartoon below. Foxtrot by Bill Amend TAT THE AMOUNT OF LES WOLD AGE OF THE VON EVERYTHING THE SCHOOL TEA MESES A MA TEACHER OTHES TO A OMED EMERS w of we BOSTE EN POR SME ANS IMA LITTLE WERED ABOUT ROND 1. Reread the problem and determine whether the situation describes linear or exponential growth. Circle your answer on the provided answer sheet. 2. On the provided answer sheet, write both a recursive and an explicit formula for the situation described. To make this best match up with our previous work, let us define Week 1 as n = 0. 3. EXCEL: Use the pattern-continuing and formula writing skills that you learned in Part 4 along with the help of your peers to enter the recursive formula in Column B of Excel to answer the question. You will also type an appropriate formula to convert the number of seconds to number of minutes in Column C and then to hours in Column D and drag those formulas down to fill in values for Weeks through 35 as well so that you can have a better sense of the amount of time described. 4. How many hours would you be spending on homework at the end of 36 weeks (n = 35)? Would you agree to this? State your responses on the provided answer sheet. 5. Our semester is only 15 weeks long. Maybe that changes your answer to the question. How much time would you spend at the end of 15 weeks (n = 14)? Keeping in mind the amount of homework done in Week 1, Week 2, etc., would you agree to this? State your responses on the provided answer sheet. Excel Project... ... Name Excel Project Answer Sheet Part 1: Weighted Average 2. Compute BY HAND the final course grade for a student with the given scores. SHOW WORK Extension Question 1 Show work for quit, homework, and project averages, noting pertinent syllabus policies. What is the lowest grade he could earn on Test 4 and still earn a C (70) for the course? Extension Question 2 it possible for John to pull his grade up from a Cto a just by improving his homework score? Why or why not? Part 2Weekly Earnings 3. The relationship between time and median weekly earnings is: (Circle one) Linea 5. State your observations about the actual data compared to the trendine. Exponential 6. Show your work and state the results of using Excel-generated trendline equation to predict median weekly earnings in 2020. 7. Explain what real world phenomena could affect median weekly earnings over time. Part 3: World Population 3. The relationship between time and world population is: (Circle one) 5. State your observations about the actual data compared to the trendline. Linear Exponential 6. Show your work and state the results of using Excel-generated trendline equation to predict the world population in 2020 and 2050. 2020 2050 7. Explain what real world phenomena could affect world population growth over time. Linear Part 4: Du's Albums 1. The relationship between # of weeks and # of albums is:(Circle one) Exponential 2 Recursive formula for number of albums after a weeks: P = 6. Explicit formula for the number of albums after n weeks: P. = 8. Based on your work in Excel, how many albums will she have after 1 year (52 weeks)? Part 5: Fox Trot Problem 1. The relationship between # of weeks and seconds of HW is:(Circle one) 2 Recursive formula for seconds of homework after a weeks: P. = Explicit formula for the seconds of homework after n weeks: P. = How many hours would you be spending on homework at the end of 36 weeks (n 35)? Would you agree to this? Time: Yes/No 5. How much time would you spend at the end of 15 weeks (n = 14)? Keeping in mind the amount of homework done in Week 1 Week 2, etc, would you agree to this? Time Yes/No Linear Exponential ch 12:38 4 Assignment Details MTH 154-N41A: Quantitative Reasoning (SP21) MTH 154 Excel Project In this major project, you will create an Excel file and answer questions about linear and exponential growth. Part 1 Download the full version of Excel, if you haven't already, from the VCCS website. You will work through the project description. Download the Excel project base file. You will need to submit this. Download the Excel project answer sheet. You will also need to submit this, and may want to print it, or just write your answers down. e Part 11 Read and work your way through the project description. Be sure to complete all the steps in Excel Submit Assignment Part 11 Read and work your way through the project description. Be sure to complete all the steps in Excel and in the answer sheet. . 8 Assignment Guidelines You need to submit both the Excel file and a picture or scan of your completed answer sheet. Be sure to check your work using the rubric. This project is due on March 21. 11:03 3 X Excel+Project... a Name Excel Project READ ALL INSTRUCTIONS THOROUGHLY. Assignment: This project has five parts. Follow the steps for each part to modify the provided base Excel file with five tabs/sheets. Use the provided answer sheet to answer all of the question as you go along Save the excel file promptly and frequently so your work is not lost. Name the file using your last name and first initial, followed by the section number for your course (for example: Smith M03B). Submit both the answer sheet and your Excel file for grading Grading: This Excel project is one of two projects you will have in the Projects category of your course grade. You will be graded on the formatting/presentation of your Excel file, the accuracy of your Excel formulas and data, and your written responses to questions about the process and results. Due dates are announced in class. Begin by downloading the "Excel Project-base file.xlsx" file from Course Materials in our course in Blackboard. Open the file, click on the first tab along the bottom of the screen labeled "Part 1 - Weighted Average", and proceed to part 1 below. Part 1: Weighted Average Math Objective: Create a formula that computes the weighted average for this class, and use the formula to make predictions about course grades. (NOTE: DO NOT use the pre-programmed Excel formula commands; write your own mathematical formula.) Excel Objectives: Use Excel to create a table. Create a formula that uses data from the table to compute a value 1. EXCEL: In your copy of the Excel Project - base file.xlsx, make sure you are on the first tab along the bottom of the screen labeled "Part 1 - Weighted Average". Create a table (see below) listing the grade categories that will be used to compute your grade for this class, along with the weight for each category. Include a column where you can type in the score eamed for that category by the student. (NOTE: Make all of your tables clear and neat by using bold/underline type for the column headings and by resizing columns as needed. Recall that points are awarded for presentation) Excel+Project... ... 2. On the provided answer sheet, compute BY HAND the final course grade for a student with the following scores: Homework average - 85, Quiz average - 72, Project average - 88, Test 1 - 75, Test 2-54. Test 3 - 95, Test 4-79. SHOW YOUR WORK. .. 1 Category Weight Score 2 Homework 20.00% 3 Quizzes 20.00% 4 Projects 15.00% 5 Test 1 11.25% 6 Test 2 11.25% 7 Test 3 11.25% & Test 4 11.25% 9 Final Grade 3. EXCEL: Generalize your work from Step #2. You will type a formula into cell C9 that will compute the final course grade for any student. Type the "+" sign first to let Excel know that you are entering a formula into the cell, then type in the formula for the weighted average. To represent the score for each category, use the location of the cell where that score would be typed. (For example, for the homework score, use C2; for the Quiz average, use C3, and so on.) Again, do NOT use the pre-programmed Excel formulas, but write out a calculation that uses only cell addresses and mathematical symbols: +,-./. (Note: Excel does not interpret parentheses as multiplication, so you must use the when telling Excel to multiply things together.) 4. EXCEL: Type the sample scores from Step #2 into the appropriate cells, and check to see that your Excel formula is working correctly by comparing the final grade calculated by Excel to your answer in #2. Use your Excel sheet to answer the following questions. Extension Questions: Use your Excel sheet to perform the calculations, and write your results/answers to the questions on the provided answer sheet. 1.John Tyler is a MTH 154 student who earned the following grades during the semester: Homework - 62,98, 75, 100, 95, 0,75,0,64, 72, Quizzes - 78, 36, 89, 0,70,55, 67, Excel Project - 70, Finance Project -90, Test 1-55, Test 2-67, Test 3 - 74. What is the lowest grade he could earn on Test 4 and still earn aC (70) for the course? You can use your Excel file to do trial and error; however, you should also be able to find this algebraically so it would be good to practice that way as well. (Refer to syllabus for grading policy.) 2. For this question, keep the Test 4 score you found in Question 11. Using your Excel file to do trial and error, explore how John's grade would have improved if he had increased his homework average. Is it possible for him to pull his grade up from a to a B just by improving his homework score? Why or why not? Excel+Project... Click on the Part 2 tab at the bottom of the screen to proceed. Part 2: Weekly Earnings Math Objectives: Analyze raw data to determine whether the data is growing linearly or exponentially Analyze a scatterplot to determine if the data is growing linearly or exponentially Use a given formula to predict future values Interpret mathematical equations, data, and graphs in the context of a real world problem. Excel Objectives: Use Excel to create a scatterplot, add an appropriate trendline, and display its formula on the graph. The table of values found on the Part 2 tab is real data from the U.S. Bureau of Labor Statistics, found at www.bls.com. The table gives the median weekly earnings of full-time wage and salary workers 25 years of age and older who have a 4-year degree, for the years 2000 to 2017 1. EXCEL: Analyze the table of values and predict whether the relationship between time and median weekly earnings is linear or exponential 2. EXCEL: Make a scatterplot for the data. First, highlight the data in the table, including the column headings. Then, on the "Insert tab, choose the scatterplot icon shown below. HS Excel Active Suite FILE HOME INSERT PAGE LAYOUT FORMULAS DATASEVIEW VIEW DESIGN FORM Shapes wotlable Recommended Table Pictures Online Screenshot Koplo Recomended Plot Tables GURT TOOLS Choose the top left hand choice as shown below. Excel will generate a scatterplot with the highlighted data. As always, you should format your graph to include appropriate title, axes titles, units, etc. We 3. Now that you have a more visual representation of the data, analyze the graph and determine whether the relationship between time and median weekly earnings is linear or exponential. Circle your answer on the provided answer sheet. 4. EXCEL: Add an appropriate trendline (linear or exponential, based on your answer above) to the graph. On the Chart Tools, Design tab, select "Add Chart Element". Growth Model - Excel Activity - Excel FORMULAS DATA REVIEW VIEW FREE HOME INSERT PAGE LAYOUT Add Chart Quick Com Element Layout Color Chart Layouts Format Trendline TRENDLINE OPTIONS li On the drop down menu, select "Trendline", then "Trendline Options": Select the appropriate kind of trendline at the top, and make sure to check the "Display Equation on chart" box near the bottom 5. What do you notice about the actual data points as compared to the trendline generated by Excel? Write your response on the provided answer sheet. Logarthmic Polynomial Order LI Moving Average Trendline Name Automatic Linear Median Weekly Euning Dollar 6. Use the equation generated by Excel to predict the median weekly earnings of full-time wage and salary workers 25 years of age and older who have a 4-year degree in the year 2020. Show your work and your answer on the provided answer sheet 7. What real world phenomena affect the growth of median weekly earnings over time? Write your response on the provided answer sheet. Custom Forca forward 00 pod period tercept Display Equation on chart Click on the Part 3 tab at the bottom of the screen in Excel to proceed. Part 3: World Population Math Objectives: Analyze raw data to determine whether the data is growing linearly or exponentially Analyze a scatterplot to determine if the data is growing linearly or exponentially Use a given formula to predict future values. Interpret mathematical equations, data, and graphs in the context of a real world problem. Excel Objectives: Use Excel to create a scatterplot, add an appropriate trendine, and display its formula on the graph. The table of values found on the Part 3 tab is real estimated world populations data from the United States Census Bureau and is a compilation of data found in two different tables (pre- and post-1950) on www.census.gov 1. EXCEL: Analyze the first two columns in the table of values and predict whether the relationship between time and world population is linear or exponential. 2. EXCEL: Make a scatterplot for the data in the first two columns, year and population. Refer to your peers or the detailed instructions found in Part 2 if you need help. As always remember to format your graph to include appropriate title, axes titles, units, etc. 3. Now that you have a more visual representation of the data, analyze the graph and determine whether the relationship between time and world population is linear or exponential. Circle your answer on the provided answer sheet 4. EXCEL: Add an appropriate trendline (linear or exponential, based on your answer above) to the graph and display its equation. Refer to your peers or the detailed instructions found in Part 2 if you need help. 5. What do you notice about the actual data points as compared to the trendline generated by Excel? What discrepancies do you see? Write your response on the provided answer sheet. 6. Use the equation generated by Excel to predict the world population in the year 2020, and in the year 2050. When generating an exponential model, Excel uses the number "e" in the base of the formula. The value of e is approximately 2.71828. For your calculations, you can either use this approximate value, or use the exbutton on your calculator. Show your work and your answer on the provided answer sheet. **NOTE: Before assuming you must be wrong when obtaining your prediction for 2020 based on the exponential model created by Excel, go back to your discussion in #5 above and think about why this anomaly might have occurred. 7. What real world phenomena would affect world population growth over time? Write your response on the provided answer sheet. Click on the Activity 3 tab at the bottom of the screen in Excel to proceed. Part 4: Do's Albums Math Objectives: Determine whether a real world situation describes linear or exponential growth Write a recursive formula to model the growth of a real world problem Write an explicit formula to model the growth of a real world problem. Use the recursive and explicit formulas to predict future values Excel Objectives: Use Excel to create a table. Enter a formula that uses data from the table to compute a value. Use excel to continue a pattern in a table without typing each cell individually. Copy and paste the formula to continue a pattern in a table. A DJ buys 3 new albums every week to keep her collection current. She currently owns 300 albums How many albums will she own one year from now? 1. Reread the problem and determine whether the situation describes linear or exponential growth. Circle your answer on the provided answer sheet. 2. On the provided answer sheet, write a recursive formula for the number of albums the Dl has after n weeks. 3. EXCEL: You will use Excel to create a table that shows the total number of albums the DJ has each week. Enter her current (initial) number of albums in cell B3. 4. EXCEL: Column A will show the number of weeks from now. Rather than typing the numbers 1 through 52, highlight cells A3 through A6, then move the mouse onto the box on the bottom right hand corner of your highlighted block until it turns to a solid cross, +. Click the cross and pull down to the rows below in order to continue the pattern. This is a very useful feature of Excel 5. EXCEL: Column B will show the current number of albums. Click on cell B4, and type a formula that gives the number of albums the DJ owns 1 week later. (Remember to begin with an = sign to tell Excel that you are writing a formula.) In your formula, use the location of the cell containing the value that you want in order to refer to that value (don't just type the number) Once you have checked that your formula makes sense, highlight B4, click the bottom right hand corner (make sure it shows the solid cross, +), and drag down to continue the pattern to the rest of the cells. You can click on a different cell in Column B and see how the formula has changed. 6. While Excel makes things easier by allowing us to drag to continue a pattern, we still really didn't need to compute all of the data for weeks 1 through 51 if we actually only need to know about week 52. If we had instead come up with an explicit formula, we could have just filled in one row to get our answer. Reread the problem to determine P, and write an explicit formula for the number of albums the DJ has after n weeks on the provided answer sheet. 7. EXCEL: Enter the value of P, in cell F3. Enter your explicit formula in cell F4, remembering to begin with an - and to either type or click the cell locations containing your P, and your in order to create the formula. Check to make sure you get the same value as when you used the recursive formula 8. Use the data computed in Excel to answer the question. How many albums will the Down 1 year from now? Write your response on the provided answer sheet. Click on the Part S tab at the bottom of the screen to proceed. Part 5: Fox Trot Problem Math Objectives: Determine whether a real world situation describes linear or exponential growth Write a recursive formula to model the growth of a real world problem Write an explicit formula to model the growth of a real world problem. Use the recursive and explicit formulas to predict future values Excel Objectives Use Excel to create a table. Enter a formula that uses data from the table to compute a value. Use excel to continue a pattern in a table without typing each cell individually. Copy and paste the formula to continue a pattern in a table, Consider the question in the Foxtrot cartoon below. Foxtrot by Bill Amend TAT THE AMOUNT OF LES WOLD AGE OF THE VON EVERYTHING THE SCHOOL TEA MESES A MA TEACHER OTHES TO A OMED EMERS w of we BOSTE EN POR SME ANS IMA LITTLE WERED ABOUT ROND 1. Reread the problem and determine whether the situation describes linear or exponential growth. Circle your answer on the provided answer sheet. 2. On the provided answer sheet, write both a recursive and an explicit formula for the situation described. To make this best match up with our previous work, let us define Week 1 as n = 0. 3. EXCEL: Use the pattern-continuing and formula writing skills that you learned in Part 4 along with the help of your peers to enter the recursive formula in Column B of Excel to answer the question. You will also type an appropriate formula to convert the number of seconds to number of minutes in Column C and then to hours in Column D and drag those formulas down to fill in values for Weeks through 35 as well so that you can have a better sense of the amount of time described. 4. How many hours would you be spending on homework at the end of 36 weeks (n = 35)? Would you agree to this? State your responses on the provided answer sheet. 5. Our semester is only 15 weeks long. Maybe that changes your answer to the question. How much time would you spend at the end of 15 weeks (n = 14)? Keeping in mind the amount of homework done in Week 1, Week 2, etc., would you agree to this? State your responses on the provided answer sheet. Excel Project... ... Name Excel Project Answer Sheet Part 1: Weighted Average 2. Compute BY HAND the final course grade for a student with the given scores. SHOW WORK Extension Question 1 Show work for quit, homework, and project averages, noting pertinent syllabus policies. What is the lowest grade he could earn on Test 4 and still earn a C (70) for the course? Extension Question 2 it possible for John to pull his grade up from a Cto a just by improving his homework score? Why or why not? Part 2Weekly Earnings 3. The relationship between time and median weekly earnings is: (Circle one) Linea 5. State your observations about the actual data compared to the trendine. Exponential 6. Show your work and state the results of using Excel-generated trendline equation to predict median weekly earnings in 2020. 7. Explain what real world phenomena could affect median weekly earnings over time. Part 3: World Population 3. The relationship between time and world population is: (Circle one) 5. State your observations about the actual data compared to the trendline. Linear Exponential 6. Show your work and state the results of using Excel-generated trendline equation to predict the world population in 2020 and 2050. 2020 2050 7. Explain what real world phenomena could affect world population growth over time. Linear Part 4: Du's Albums 1. The relationship between # of weeks and # of albums is:(Circle one) Exponential 2 Recursive formula for number of albums after a weeks: P = 6. Explicit formula for the number of albums after n weeks: P. = 8. Based on your work in Excel, how many albums will she have after 1 year (52 weeks)? Part 5: Fox Trot Problem 1. The relationship between # of weeks and seconds of HW is:(Circle one) 2 Recursive formula for seconds of homework after a weeks: P. = Explicit formula for the seconds of homework after n weeks: P. = How many hours would you be spending on homework at the end of 36 weeks (n 35)? Would you agree to this? Time: Yes/No 5. How much time would you spend at the end of 15 weeks (n = 14)? Keeping in mind the amount of homework done in Week 1 Week 2, etc, would you agree to this? Time Yes/No Linear Exponential ch
Step by Step Solution
There are 3 Steps involved in it

Get step-by-step solutions from verified subject matter experts