Answered step by step
Verified Expert Solution
Link Copied!

Question

1 Approved Answer

12:53 5 62% } 0 The figure below shows the H xy diagram for a flash process. Using the figure below, answer the following questions:
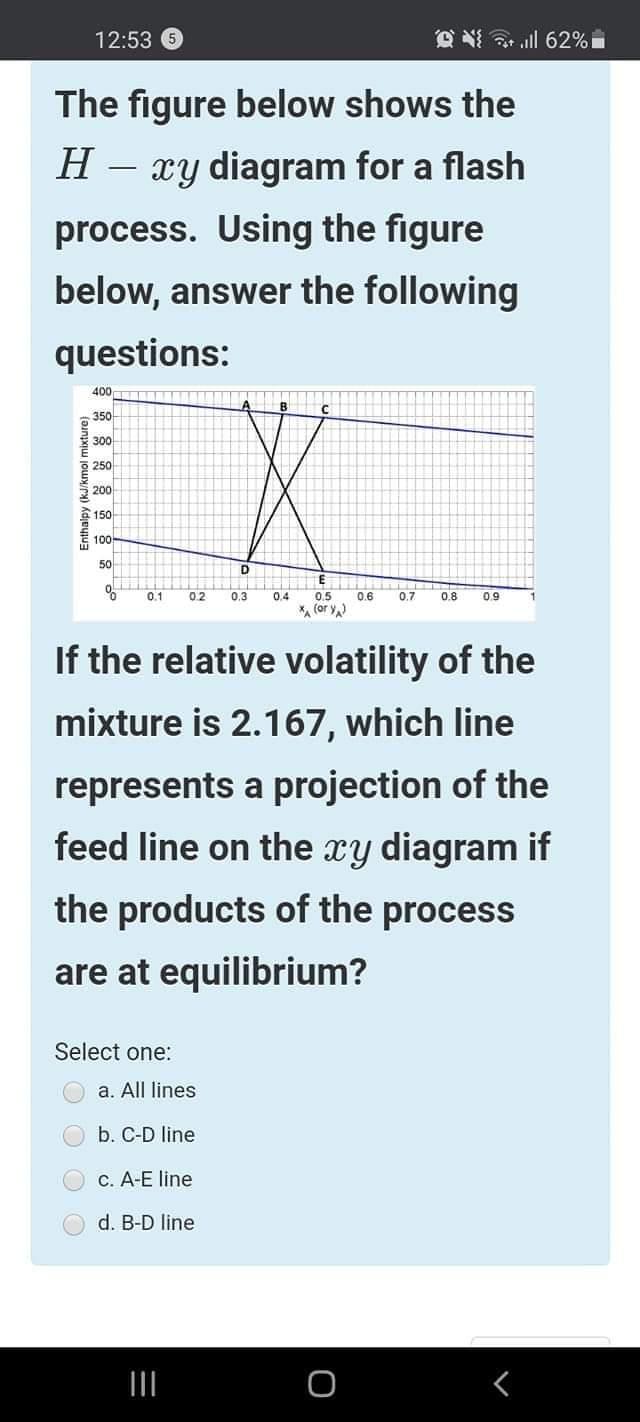
image text in transcribed

12:53 5 62% } 0 The figure below shows the H xy diagram for a flash process. Using the figure below, answer the following questions: 400 350 300 250 Enthalpy (kJ/kmol mixture) 200 150 100 50 D % 0.1 02 0.3 0.4 0.6 0.7 0.8 0.9 0.5 (ory If the relative volatility of the mixture is 2.167, which line represents a projection of the feed line on the xy diagram if the products of the process are at equilibrium? Select one: a. All lines b. C-D line C. A-E line d. B-D line III o

Step by Step Solution

There are 3 Steps involved in it

Step: 1

blur-text-image

Get Instant Access to Expert-Tailored Solutions

See step-by-step solutions with expert insights and AI powered tools for academic success

Step: 2

blur-text-image

Step: 3

blur-text-image

Ace Your Homework with AI

Get the answers you need in no time with our AI-driven, step-by-step assistance

Get Started

Recommended Textbook for

Introduction To Chemical Engineering Computing

Authors: Bruce A. Finlayson

2nd Edition

1118888316, 978-1118888315

More Books

Students also viewed these Chemical Engineering questions