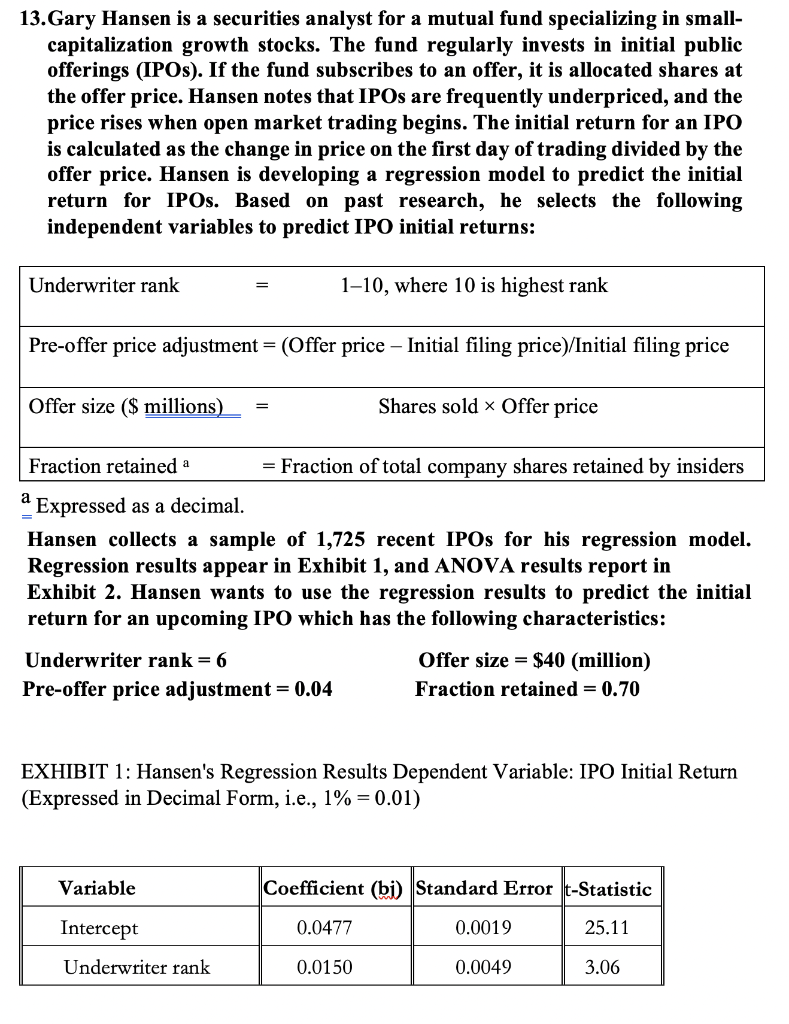
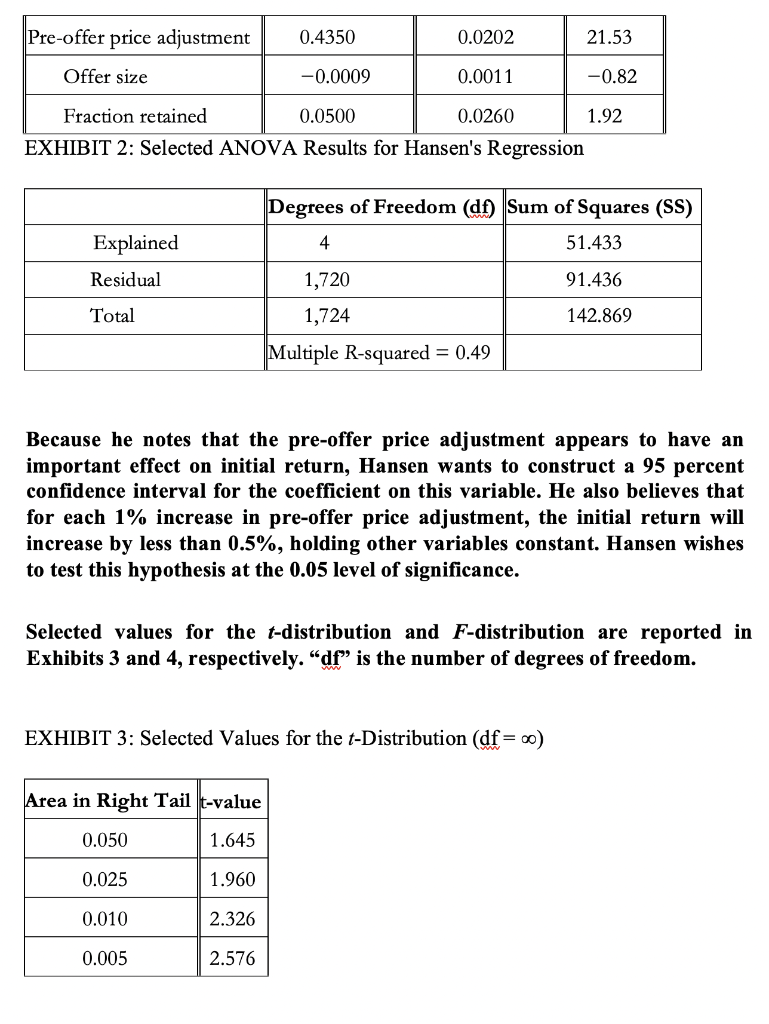
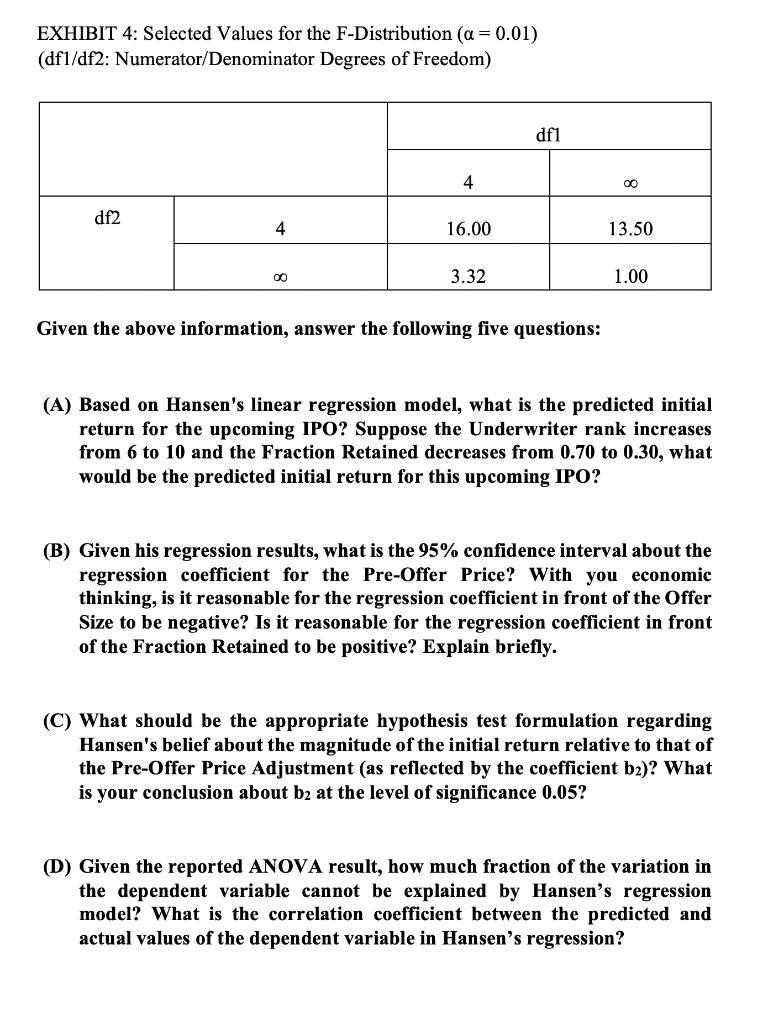
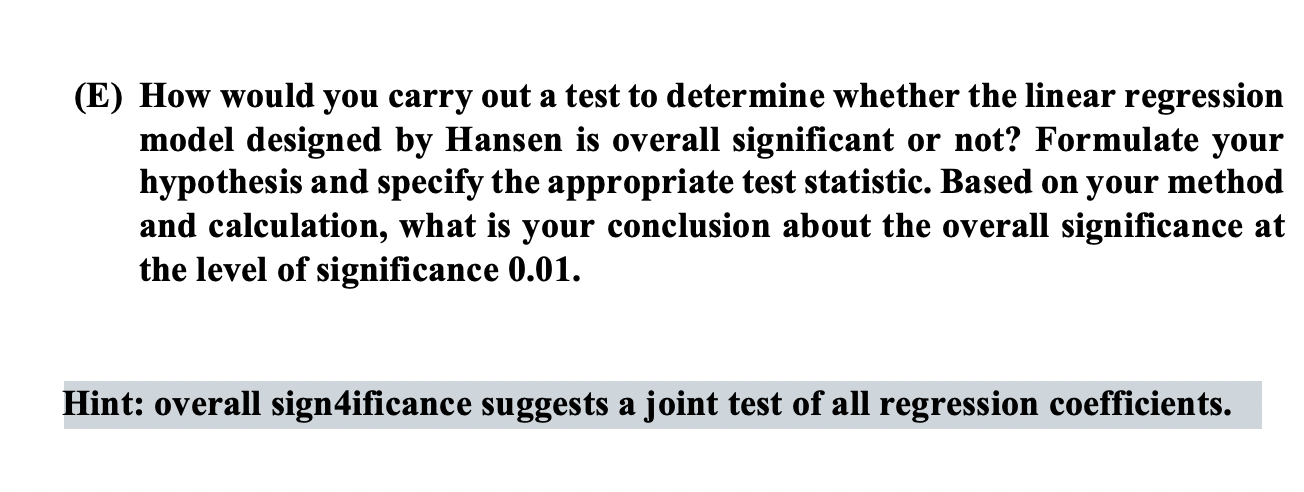
13. Gary Hansen is a securities analyst for a mutual fund specializing in smallcapitalization growth stocks. The fund regularly invests in initial public offerings (IPOs). If the fund subscribes to an offer, it is allocated shares at the offer price. Hansen notes that IPOs are frequently underpriced, and the price rises when open market trading begins. The initial return for an IPO is calculated as the change in price on the first day of trading divided by the offer price. Hansen is developing a regression model to predict the initial return for IPOs. Based on past research, he selects the following independent variables to predict IPO initial returns: = Expressed as a decimal. Hansen collects a sample of 1,725 recent IPOs for his regression model. Regression results appear in Exhibit 1, and ANOVA results report in Exhibit 2. Hansen wants to use the regression results to predict the initial return for an upcoming IPO which has the following characteristics: Underwriterrank=6Pre-offerpriceadjustment=0.04Offersize=$40(million)Fractionretained=0.70 Pre-offer price adjustment =0.04 Fraction retained =0.70 EXHIBIT 1: Hansen's Regression Results Dependent Variable: IPO Initial Return (Expressed in Decimal Form, i.e., 1%=0.01 ) EXHIBIT 2: Selected ANOVA Results for Hansen's Regression Because he notes that the pre-offer price adjustment appears to have an important effect on initial return, Hansen wants to construct a 95 percent confidence interval for the coefficient on this variable. He also believes that for each 1% increase in pre-offer price adjustment, the initial return will increase by less than 0.5%, holding other variables constant. Hansen wishes to test this hypothesis at the 0.05 level of significance. Selected values for the t-distribution and F-distribution are reported in Exhibits 3 and 4, respectively. "df" is the number of degrees of freedom. EXHIBIT 3: Selected Values for the t-Distribution (df=) EXHIBIT 4: Selected Values for the F-Distribution (=0.01) (df1/df2: Numerator/Denominator Degrees of Freedom) Given the above information, answer the following five questions: (A) Based on Hansen's linear regression model, what is the predicted initial return for the upcoming IPO? Suppose the Underwriter rank increases from 6 to 10 and the Fraction Retained decreases from 0.70 to 0.30, what would be the predicted initial return for this upcoming IPO? (B) Given his regression results, what is the 95% confidence interval about the regression coefficient for the Pre-Offer Price? With you economic thinking, is it reasonable for the regression coefficient in front of the Offer Size to be negative? Is it reasonable for the regression coefficient in front of the Fraction Retained to be positive? Explain briefly. (C) What should be the appropriate hypothesis test formulation regarding Hansen's belief about the magnitude of the initial return relative to that of the Pre-Offer Price Adjustment (as reflected by the coefficient b2 )? What is your conclusion about b2 at the level of significance 0.05 ? (D) Given the reported ANOVA result, how much fraction of the variation in the dependent variable cannot be explained by Hansen's regression model? What is the correlation coefficient between the predicted and actual values of the dependent variable in Hansen's regression? (E) How would you carry out a test to determine whether the linear regression model designed by Hansen is overall significant or not? Formulate your hypothesis and specify the appropriate test statistic. Based on your method and calculation, what is your conclusion about the overall significance at the level of significance 0.01. Hint: overall sign4ificance suggests a joint test of all regression coefficients. 13. Gary Hansen is a securities analyst for a mutual fund specializing in smallcapitalization growth stocks. The fund regularly invests in initial public offerings (IPOs). If the fund subscribes to an offer, it is allocated shares at the offer price. Hansen notes that IPOs are frequently underpriced, and the price rises when open market trading begins. The initial return for an IPO is calculated as the change in price on the first day of trading divided by the offer price. Hansen is developing a regression model to predict the initial return for IPOs. Based on past research, he selects the following independent variables to predict IPO initial returns: = Expressed as a decimal. Hansen collects a sample of 1,725 recent IPOs for his regression model. Regression results appear in Exhibit 1, and ANOVA results report in Exhibit 2. Hansen wants to use the regression results to predict the initial return for an upcoming IPO which has the following characteristics: Underwriterrank=6Pre-offerpriceadjustment=0.04Offersize=$40(million)Fractionretained=0.70 Pre-offer price adjustment =0.04 Fraction retained =0.70 EXHIBIT 1: Hansen's Regression Results Dependent Variable: IPO Initial Return (Expressed in Decimal Form, i.e., 1%=0.01 ) EXHIBIT 2: Selected ANOVA Results for Hansen's Regression Because he notes that the pre-offer price adjustment appears to have an important effect on initial return, Hansen wants to construct a 95 percent confidence interval for the coefficient on this variable. He also believes that for each 1% increase in pre-offer price adjustment, the initial return will increase by less than 0.5%, holding other variables constant. Hansen wishes to test this hypothesis at the 0.05 level of significance. Selected values for the t-distribution and F-distribution are reported in Exhibits 3 and 4, respectively. "df" is the number of degrees of freedom. EXHIBIT 3: Selected Values for the t-Distribution (df=) EXHIBIT 4: Selected Values for the F-Distribution (=0.01) (df1/df2: Numerator/Denominator Degrees of Freedom) Given the above information, answer the following five questions: (A) Based on Hansen's linear regression model, what is the predicted initial return for the upcoming IPO? Suppose the Underwriter rank increases from 6 to 10 and the Fraction Retained decreases from 0.70 to 0.30, what would be the predicted initial return for this upcoming IPO? (B) Given his regression results, what is the 95% confidence interval about the regression coefficient for the Pre-Offer Price? With you economic thinking, is it reasonable for the regression coefficient in front of the Offer Size to be negative? Is it reasonable for the regression coefficient in front of the Fraction Retained to be positive? Explain briefly. (C) What should be the appropriate hypothesis test formulation regarding Hansen's belief about the magnitude of the initial return relative to that of the Pre-Offer Price Adjustment (as reflected by the coefficient b2 )? What is your conclusion about b2 at the level of significance 0.05 ? (D) Given the reported ANOVA result, how much fraction of the variation in the dependent variable cannot be explained by Hansen's regression model? What is the correlation coefficient between the predicted and actual values of the dependent variable in Hansen's regression? (E) How would you carry out a test to determine whether the linear regression model designed by Hansen is overall significant or not? Formulate your hypothesis and specify the appropriate test statistic. Based on your method and calculation, what is your conclusion about the overall significance at the level of significance 0.01. Hint: overall sign4ificance suggests a joint test of all regression coefficients