

Answered step by step
Verified Expert Solution
Question
1 Approved Answer
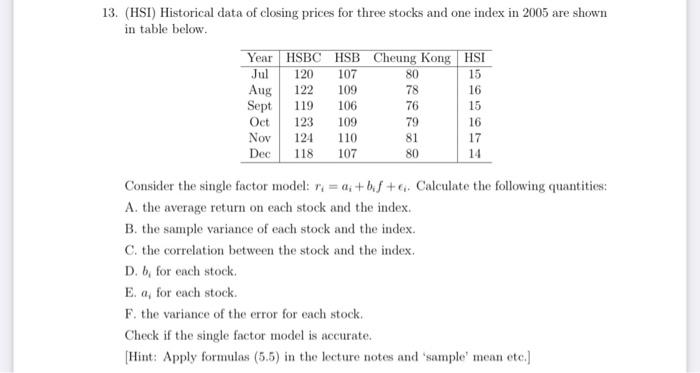
13. (HSI) Historical data of closing prices for three stocks and one index in 2005 are shown in table below. Year HSBC HSB Cheung Kong
Step by Step Solution
There are 3 Steps involved in it
Step: 1

Get Instant Access to Expert-Tailored Solutions
See step-by-step solutions with expert insights and AI powered tools for academic success
Step: 2

Step: 3
Ace Your Homework with AI
Get the answers you need in no time with our AI-driven, step-by-step assistance
Get Started
Fundamentals Of Multinational Finance
Authors: Michael Moffett
6th Global Edition
1292215216, 978-1292215211