Answered step by step
Verified Expert Solution
Link Copied!

Question

1 Approved Answer

13 The following atrribute data was collected. 14 Each day 20 patrons were asked if they enjoyed their meal. 15. Analyze the data. Create control
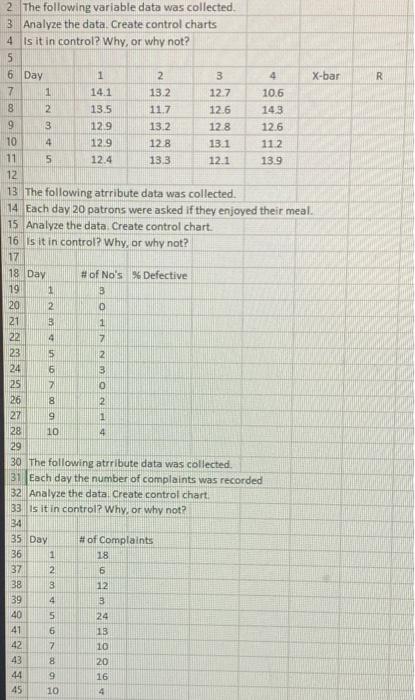
image text in transcribed
13 The following atrribute data was collected. 14 Each day 20 patrons were asked if they enjoyed their meal. 15. Analyze the data. Create control chart. 16 Is it in control? Why, or why not? 17 30. The following atrribute data was collected. Each day the number of complaints was recorded 32. Analyze the data Create control chart. 33 Is it in control? Why, or why not? 13 The following atrribute data was collected. 14 Each day 20 patrons were asked if they enjoyed their meal. 15. Analyze the data. Create control chart. 16 Is it in control? Why, or why not? 17 30. The following atrribute data was collected. Each day the number of complaints was recorded 32. Analyze the data Create control chart. 33 Is it in control? Why, or why not

Step by Step Solution

There are 3 Steps involved in it

Step: 1

blur-text-image

Get Instant Access to Expert-Tailored Solutions

See step-by-step solutions with expert insights and AI powered tools for academic success

Step: 2

blur-text-image_2

Step: 3

blur-text-image_3

Ace Your Homework with AI

Get the answers you need in no time with our AI-driven, step-by-step assistance

Get Started

Recommended Textbook for

Strategic management concepts

Authors: Fred david

13th Edition

9780136120988, 136120997, 136120989, 978-0136120995

More Books

Students also viewed these General Management questions