Answered step by step
Verified Expert Solution
Question
1 Approved Answer
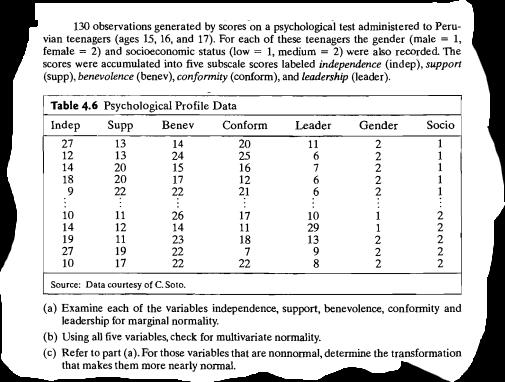
130 observations generated by scores on a psychological test administered to Peru- vian teenagers (ages 15, 16, and 17). For each of these teenagers

130 observations generated by scores on a psychological test administered to Peru- vian teenagers (ages 15, 16, and 17). For each of these teenagers the gender (male = 1, female = 2) and socioeconomic status (low = 1, medium = 2) were also recorded. The scores were accumulated into five subscale scores labeled independence (indep), support (supp), benevolence (benev), conformity (conform), and leadership (leader). Table 4.6 Psychological Profile Data Indep Supp Benev 27 12 14 72289 18 10 4 19 27 10 14 13. STERE B8855 13 20 20 22 11 12 11 19 17 14 ERKEN BINN 24 15 17 22 26 14 23 22 22 Source: Data courtesy of C. Soto. Conform 20 SAREN SURIN 25 16 12 21 : 17 11 18 7 22 Leader 11 6 7 6 10 29 13 9 8 Gender NNNNNN22 Socio 1 22222 (a) Examine each of the variables independence, support, benevolence, conformity and leadership for marginal normality. (b) Using all five variables, check for multivariate normality. (c) Refer to part (a). For those variables that are nonnormal, determine the transformation that makes them more nearly normal.
Step by Step Solution
★★★★★
3.40 Rating (150 Votes )
There are 3 Steps involved in it
Step: 1
a To examine marginal normality for each variable you can ...
Get Instant Access to Expert-Tailored Solutions
See step-by-step solutions with expert insights and AI powered tools for academic success
Step: 2

Step: 3

Ace Your Homework with AI
Get the answers you need in no time with our AI-driven, step-by-step assistance
Get Started


