

Question: 19. The above figure shows a graph of the market for pizzas in a large town. If the price increases from S7 to S8
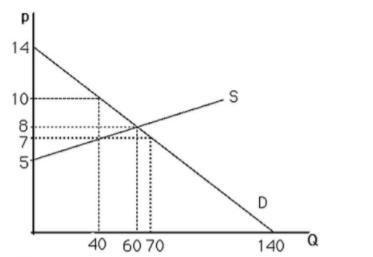
19. The above figure shows a graph of the market for pizzas in a large town. If the price increases from S7 to S8 per pizza, the quantity of pizzas demanded will: O decrease by 10. increase by 30 decrease by 30. O increase by 20 14 10 8 71 5 D 40 60 70 140
Step by Step Solution
★★★★★
3.45 Rating (155 Votes )
There are 3 Steps involved in it
1 Expert Approved Answer
Step: 1 Unlock

option 1 is correct Decrease ... View full answer
Question Has Been Solved by an Expert!
Get step-by-step solutions from verified subject matter experts
Step: 2 Unlock
Step: 3 Unlock