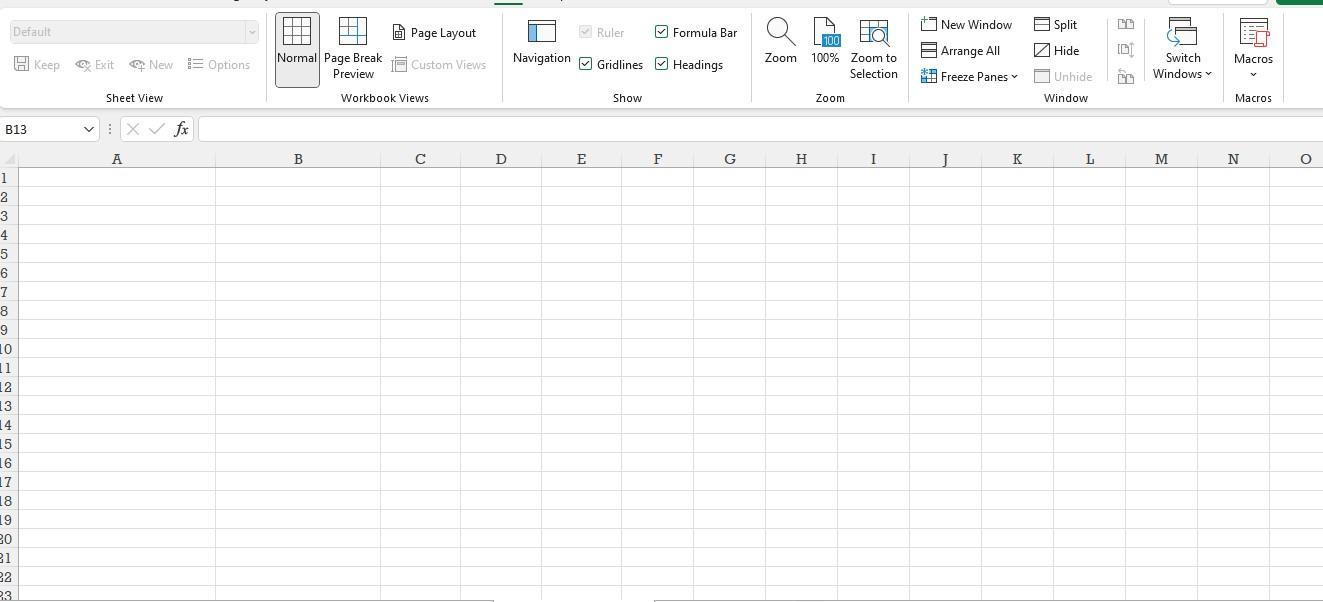
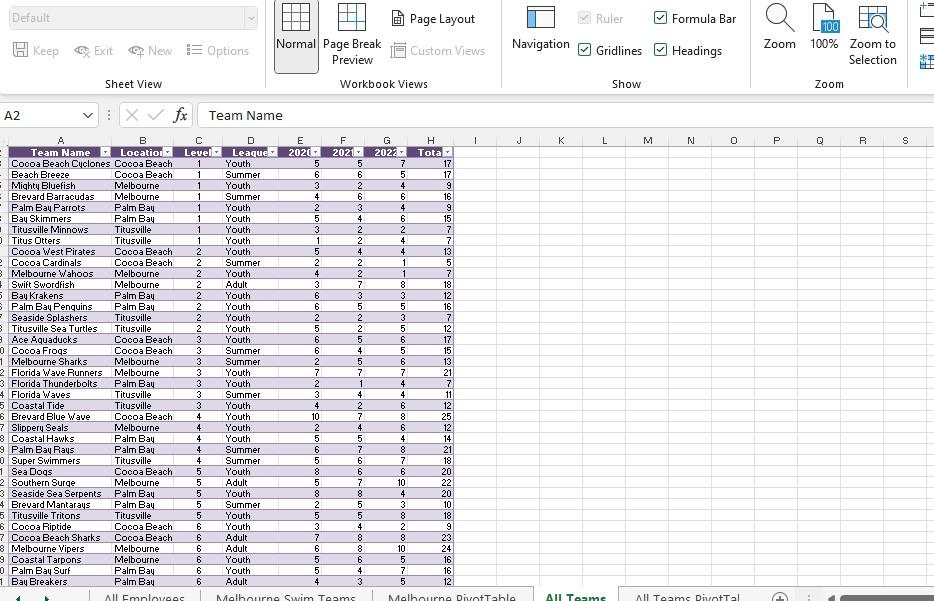
14. Brittany wants to display the Melbourne swim teams data by league and year. She asks you to create a PivotTable to better manipulate and filter the data. Switch to the Melbourne PivotTable worksheet, and then create a PivotTable in cell A1 based on the Swim Teams table. Update the PivotTable as follows so that it matches Final Figure 3: a. Change the PivotTable name to: MelbournePivot Table b. C. d. e. f. 9. h. Add the League field and the Team Name field (in that order) to the Rows area. Add the 2020, 2021, and 2022 fields (in that order) to the Values area. Change the display of subtotals to Show all Subtotals at Bottom of Group. Change the report layout to Show in Outline Form. Update the Sum of 2020 field in the Values area to display the name 2020 Wins with the Number number format with 0 decimal places. Update the Sum of 2021 field in the Values area to display the name 2021 Wins with the Number number format with 0 decimal places. Update the Sum of 2022 field in the Values area to display the name 2022 Wins with the Number number format with 0 decimal places. 15. Brittany wants to summarize data for all teams in a PivotTable. To do so, she must first update the AllTeams table. Switch to the All Teams worksheet then edit the record for the Brevard Blue Wave (row 26) to use 10 as the 2020 field value. 16. Switch to the All Teams PivotTable worksheet. Refresh the PivotTable data, then verify that the 2020 Wins value for the Brevard Blue Wave reflects the change you made in the previous step. 17. Apply the Lavender, Pivot Style Medium 13 PivotTable style to the PivotTable. 18. Add the League field to the Filters area of the Pivot Table. Filter the table so that only teams in the Youth league are displayed. 1 2 3 4 5 B13 6 7 8 9 10 11 12 13 14 15 16 17 18 19 30 31 32 Default 23 H Keep Exit New Options Sheet View A X fx Normal Page Break Preview B Page Layout Custom Views Workbook Views C D Ruler Navigation Gridlines E Show F Formula Bar Headings G Zoom H 100 100% Zoom to Selection Zoom I New Window Arrange All Freeze Panes J K Split Hide Unhide Window L 9 3 8 Switch Windows M Macros V Macros N O Default A2 Keep Team Name Cocoa Beach Cyclones Beach Breeze Mighty Bluefish Brevard Barracudas Palm Bay Parrots Bay Skimmers Titusville Minnows OTitus Otters Cocoa West Pirates 2 Cocoa Cardinals Melbourne Wahoos Swift Swordfish 5 Bay Krakens Palm Bay Penguins Seaside Splashers Titusville Sea Turtles Exit 9 Ace Aquaducks 0 Cocoa Frogs 1 Melbourne Sharks 2 Florida Wave Runners 3 Florida Thunderbolts 4 Florida Waves 5 Coastal Tide 6 Brevard Blue Wave 7 Slippery Seals 8 Coastal Hawks 9 Palm Bay Rays 0 Super Swimmers 1 Sea Dogs 2 Southern Surge 3 Seaside Sea Serpents 4 Brevard Mantarays 5 Titusville Tritons 6 Cocoa Riptide 7 Cocoa Beach Sharks 8 Melbourne Vipers 99 Coastal Tarpons 0 Palm Bay Surf 1 Bay Breakers New Options Sheet View X fx B Location Cocoa Beach Cocoa Beach Melbourne Melbourne Palm Bay Palm Bay Titusville Titusville Cocoa Beach Cocoa Beach Melbourne Melbourne Palm Bay Palm Bay Titusville Titusville Cocoa Beach Cocoa Beach Melbourne Melbourne Palm Bay Titusville Titusville Cocoa Beach Melbourne Palm Bay Palm Bay C Level 1 1 Titusville Cocoa Beach Melbourne Palm Bay Palm Bay Titusville Cocoa Beach Cocoa Beach Melbourne Melbourne. Palm Bay Palm Bay All Employees 1 1 1 1 1 1 2 2 2 2 2 2 2 2 3 3 3 3 3 3 3 4 4 4 4 4 5 5 5 5 5 6 6 6 6 6 6 Team Name D Leaque Youth Summer Youth Summer Youth Youth Youth Youth Youth Summer Youth Adult Youth Youth Youth Youth Youth Summer Summer Youth Youth Summer Youth Youth Youth Youth Summer Summer Normal Page Break Preview Youth Adult Youth E 2020- 5 6 3 4 2 5 3 1 5 2 4 3 6 6 2 5 6 6 2 7 2 3 4 10 2 5 6 5 8 5 8 2 5 3 7 6 5 5 4 Workbook Views F G 2021 2022- 5 6 2 Summer Youth Youth Adult Adult Youth Youth Adult Melbourne Swim Teams 6 3 4 2 2 4 2 2 7 3 5 2 2 5 4 5 7 1 4 2 7 4 5 7 6 6 7 8 5 5 4 8 8 6 4 3 7 5 4 6 4 6 2 4 4 1 1 8 3 5 3 5 6 5 6 7 4 4 6 8 6 4 8 7 6 10 4 3 8 2 8 10 Page Layout Custom Views 5 7 5 H Tota 17 17 9 16 9 15 7 7 13 5 7 18 12 16 7 12 17 15 13 21 7 11 12 25 12 14 21 18 20 22 20 10 18 9 23 24 16 16 12 1 Navigation J Melbourne PivotTable K Ruler Gridlines Headings L All Teams Show Formula Bar M N 0 All Teams PivotTal Zoom P 100 100% Zoom to Selection Zoom Q R 30 S = Level 6 = Default 2 5 6 7 B Keep 9 0 1 2 3. Exit Exit New E Options 4 Sheet View : X fx A Row Labels = 0 1 Titusville Cocoa Beach Brevard Blue Wave 2 3 Grand Total 4 Melbourne Slippery Seals Palm Bay Coastal Hawks Palm Bay Rays Super Swimmers *** B Melbourne Swim Teams 10 2 2020 Wins 2021 Wins 2022 Wins 5 6 5 28 HH PH Normal Page Break Preview Workbook Views 7 4 5 7 D 6 29 Page Layout Custom Views Melbourne PivotTable 8 6 4 8 7 33 E All Teams F Ruler Navigation Gridlines Headings Level 1 2 3 4 5 6 O Show G VE & Formula Bar All Teams PivotTable H HOI 100 Zoom 100% Zoom to Selection. I Swim Leve ... + Zoom J K New window Arrange All Freeze Panes L Split Hide Unhide Window V ITA W 3 2 8 X 21 Switch Windows Y D Z Macro v Macro AA 14. Brittany wants to display the Melbourne swim teams data by league and year. She asks you to create a PivotTable to better manipulate and filter the data. Switch to the Melbourne PivotTable worksheet, and then create a PivotTable in cell A1 based on the Swim Teams table. Update the PivotTable as follows so that it matches Final Figure 3: a. Change the PivotTable name to: MelbournePivot Table b. C. d. e. f. 9. h. Add the League field and the Team Name field (in that order) to the Rows area. Add the 2020, 2021, and 2022 fields (in that order) to the Values area. Change the display of subtotals to Show all Subtotals at Bottom of Group. Change the report layout to Show in Outline Form. Update the Sum of 2020 field in the Values area to display the name 2020 Wins with the Number number format with 0 decimal places. Update the Sum of 2021 field in the Values area to display the name 2021 Wins with the Number number format with 0 decimal places. Update the Sum of 2022 field in the Values area to display the name 2022 Wins with the Number number format with 0 decimal places. 15. Brittany wants to summarize data for all teams in a PivotTable. To do so, she must first update the AllTeams table. Switch to the All Teams worksheet then edit the record for the Brevard Blue Wave (row 26) to use 10 as the 2020 field value. 16. Switch to the All Teams PivotTable worksheet. Refresh the PivotTable data, then verify that the 2020 Wins value for the Brevard Blue Wave reflects the change you made in the previous step. 17. Apply the Lavender, Pivot Style Medium 13 PivotTable style to the PivotTable. 18. Add the League field to the Filters area of the Pivot Table. Filter the table so that only teams in the Youth league are displayed. 1 2 3 4 5 B13 6 7 8 9 10 11 12 13 14 15 16 17 18 19 30 31 32 Default 23 H Keep Exit New Options Sheet View A X fx Normal Page Break Preview B Page Layout Custom Views Workbook Views C D Ruler Navigation Gridlines E Show F Formula Bar Headings G Zoom H 100 100% Zoom to Selection Zoom I New Window Arrange All Freeze Panes J K Split Hide Unhide Window L 9 3 8 Switch Windows M Macros V Macros N O Default A2 Keep Team Name Cocoa Beach Cyclones Beach Breeze Mighty Bluefish Brevard Barracudas Palm Bay Parrots Bay Skimmers Titusville Minnows OTitus Otters Cocoa West Pirates 2 Cocoa Cardinals Melbourne Wahoos Swift Swordfish 5 Bay Krakens Palm Bay Penguins Seaside Splashers Titusville Sea Turtles Exit 9 Ace Aquaducks 0 Cocoa Frogs 1 Melbourne Sharks 2 Florida Wave Runners 3 Florida Thunderbolts 4 Florida Waves 5 Coastal Tide 6 Brevard Blue Wave 7 Slippery Seals 8 Coastal Hawks 9 Palm Bay Rays 0 Super Swimmers 1 Sea Dogs 2 Southern Surge 3 Seaside Sea Serpents 4 Brevard Mantarays 5 Titusville Tritons 6 Cocoa Riptide 7 Cocoa Beach Sharks 8 Melbourne Vipers 99 Coastal Tarpons 0 Palm Bay Surf 1 Bay Breakers New Options Sheet View X fx B Location Cocoa Beach Cocoa Beach Melbourne Melbourne Palm Bay Palm Bay Titusville Titusville Cocoa Beach Cocoa Beach Melbourne Melbourne Palm Bay Palm Bay Titusville Titusville Cocoa Beach Cocoa Beach Melbourne Melbourne Palm Bay Titusville Titusville Cocoa Beach Melbourne Palm Bay Palm Bay C Level 1 1 Titusville Cocoa Beach Melbourne Palm Bay Palm Bay Titusville Cocoa Beach Cocoa Beach Melbourne Melbourne. Palm Bay Palm Bay All Employees 1 1 1 1 1 1 2 2 2 2 2 2 2 2 3 3 3 3 3 3 3 4 4 4 4 4 5 5 5 5 5 6 6 6 6 6 6 Team Name D Leaque Youth Summer Youth Summer Youth Youth Youth Youth Youth Summer Youth Adult Youth Youth Youth Youth Youth Summer Summer Youth Youth Summer Youth Youth Youth Youth Summer Summer Normal Page Break Preview Youth Adult Youth E 2020- 5 6 3 4 2 5 3 1 5 2 4 3 6 6 2 5 6 6 2 7 2 3 4 10 2 5 6 5 8 5 8 2 5 3 7 6 5 5 4 Workbook Views F G 2021 2022- 5 6 2 Summer Youth Youth Adult Adult Youth Youth Adult Melbourne Swim Teams 6 3 4 2 2 4 2 2 7 3 5 2 2 5 4 5 7 1 4 2 7 4 5 7 6 6 7 8 5 5 4 8 8 6 4 3 7 5 4 6 4 6 2 4 4 1 1 8 3 5 3 5 6 5 6 7 4 4 6 8 6 4 8 7 6 10 4 3 8 2 8 10 Page Layout Custom Views 5 7 5 H Tota 17 17 9 16 9 15 7 7 13 5 7 18 12 16 7 12 17 15 13 21 7 11 12 25 12 14 21 18 20 22 20 10 18 9 23 24 16 16 12 1 Navigation J Melbourne PivotTable K Ruler Gridlines Headings L All Teams Show Formula Bar M N 0 All Teams PivotTal Zoom P 100 100% Zoom to Selection Zoom Q R 30 S = Level 6 = Default 2 5 6 7 B Keep 9 0 1 2 3. Exit Exit New E Options 4 Sheet View : X fx A Row Labels = 0 1 Titusville Cocoa Beach Brevard Blue Wave 2 3 Grand Total 4 Melbourne Slippery Seals Palm Bay Coastal Hawks Palm Bay Rays Super Swimmers *** B Melbourne Swim Teams 10 2 2020 Wins 2021 Wins 2022 Wins 5 6 5 28 HH PH Normal Page Break Preview Workbook Views 7 4 5 7 D 6 29 Page Layout Custom Views Melbourne PivotTable 8 6 4 8 7 33 E All Teams F Ruler Navigation Gridlines Headings Level 1 2 3 4 5 6 O Show G VE & Formula Bar All Teams PivotTable H HOI 100 Zoom 100% Zoom to Selection. I Swim Leve ... + Zoom J K New window Arrange All Freeze Panes L Split Hide Unhide Window V ITA W 3 2 8 X 21 Switch Windows Y D Z Macro v Macro AA