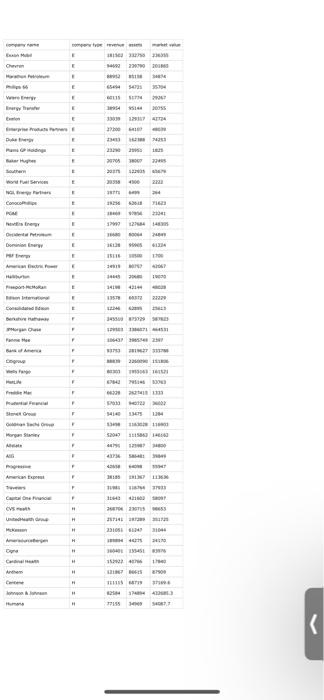
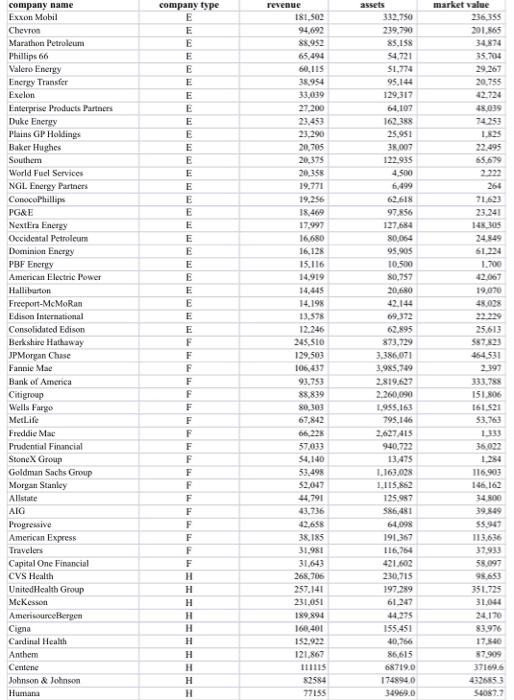
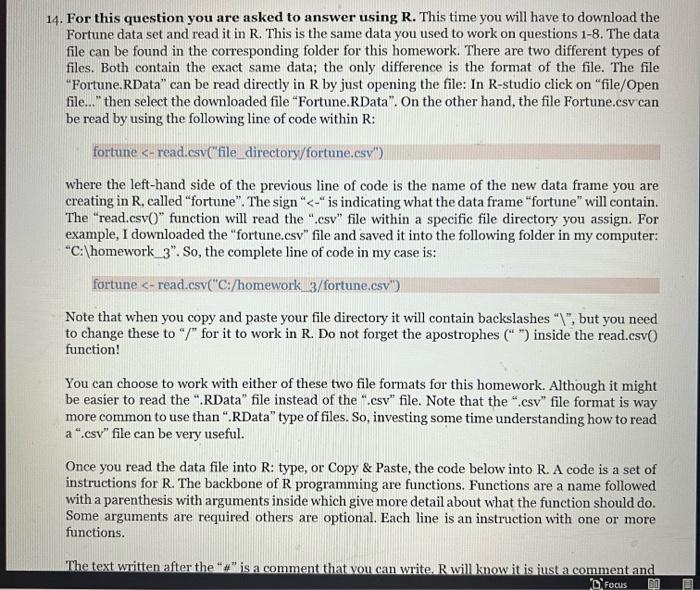
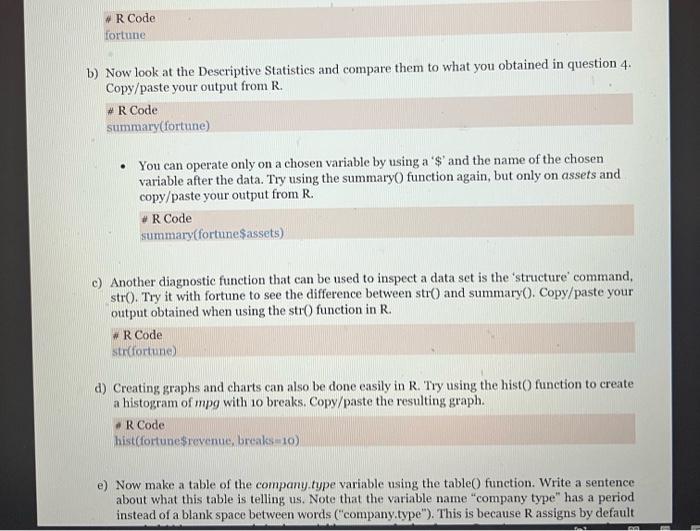
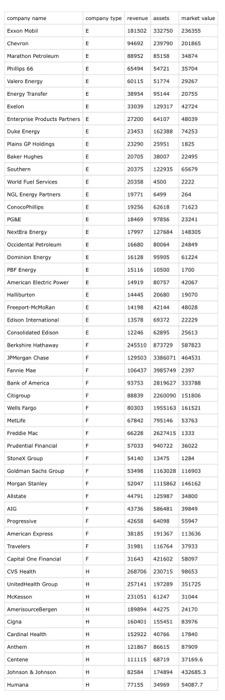
14. For this question you are asked to answer using R. This time you will have to download the Fortune data set and read it in R. This is the same data you used to work on questions 1-8. The data file can be found in the corresponding folder for this homework. There are two different types of files. Both contain the exact same data; the only difference is the format of the file. The file "Fortune.RData" can be read directly in R by just opening the file: In R-studio click on "file/Open file..." then select the downloaded file "Fortune.RData". On the other hand, the file Fortune.csv can be read by using the following line of code within R: fortune \ ", but you need to change these to "/ for it to work in R. Do not forget the apostrophes (" ") inside the read.csv() function! You can choose to work with either of these two file formats for this homework. Although it might be easier to read the ".RData" file instead of the ".csv" file. Note that the ".csv" file format is way more common to use than ".RData" type of files. So, investing some time understanding how to read a ".csv" file can be very useful. Once you read the data file into R: type, or Copy \& Paste, the code below into R. A code is a set of instructions for R. The backbone of R programming are functions. Functions are a name followed with a parenthesis with arguments inside which give more detail about what the function should do. Some arguments are required others are optional. Each line is an instruction with one or more functions. The text written after the " # " is a comment that you can write. R will know it is iust a comment and - You can operate only on a chosen variable by using a '\$' and the name of the chosen variable after the data. Try using the summary O function again, but only on assets and copy/paste your output from R. * R Code summary(fortune\$assets) c) Another diagnostic function that can be used to inspect a data set is the 'structure' command, strO. Try it with fortune to see the difference between str() and summary(). Copy/paste your output obtained when using the strO function in R. \# R Code str(fortane) d) Creating graphs and charts can also be done easily in R. Try using the hist O function to create a histogram of mpg with 10 breaks. Copy/paste the resulting graph. - R Code hist(fortunesrevenue, breaks=10) e) Now make a table of the company.type variable using the table() function. Write a sentence about what this table is telling us. Note that the variable name "company type" has a period instead of a blank space between words ("company.type"). This is because R assigns by default f) Using the table() function combined with the pie() function, create a pie chart of the company.type variable. Copy/paste the resulting chart. \# R Code pie(table(fortunescompanyitype)) g) Now, make a basic scatterplot of revenue vs. market.value. Copy/paste the resulting plot. Describe what you observe about the relationship between revenue and marketvalue in a couple sentences. \# R Code plot(fortunesmarket.value, fortunesrevenue) 11111111111111111111111111111111111 1 14. For this question you are asked to answer using R. This time you will have to download the Fortune data set and read it in R. This is the same data you used to work on questions 1-8. The data file can be found in the corresponding folder for this homework. There are two different types of files. Both contain the exact same data; the only difference is the format of the file. The file "Fortune.RData" can be read directly in R by just opening the file: In R-studio click on "file/Open file..." then select the downloaded file "Fortune.RData". On the other hand, the file Fortune.csv can be read by using the following line of code within R: fortune \ ", but you need to change these to "/ for it to work in R. Do not forget the apostrophes (" ") inside the read.csv() function! You can choose to work with either of these two file formats for this homework. Although it might be easier to read the ".RData" file instead of the ".csv" file. Note that the ".csv" file format is way more common to use than ".RData" type of files. So, investing some time understanding how to read a ".csv" file can be very useful. Once you read the data file into R: type, or Copy \& Paste, the code below into R. A code is a set of instructions for R. The backbone of R programming are functions. Functions are a name followed with a parenthesis with arguments inside which give more detail about what the function should do. Some arguments are required others are optional. Each line is an instruction with one or more functions. The text written after the " # " is a comment that you can write. R will know it is iust a comment and - You can operate only on a chosen variable by using a '\$' and the name of the chosen variable after the data. Try using the summary O function again, but only on assets and copy/paste your output from R. * R Code summary(fortune\$assets) c) Another diagnostic function that can be used to inspect a data set is the 'structure' command, strO. Try it with fortune to see the difference between str() and summary(). Copy/paste your output obtained when using the strO function in R. \# R Code str(fortane) d) Creating graphs and charts can also be done easily in R. Try using the hist O function to create a histogram of mpg with 10 breaks. Copy/paste the resulting graph. - R Code hist(fortunesrevenue, breaks=10) e) Now make a table of the company.type variable using the table() function. Write a sentence about what this table is telling us. Note that the variable name "company type" has a period instead of a blank space between words ("company.type"). This is because R assigns by default f) Using the table() function combined with the pie() function, create a pie chart of the company.type variable. Copy/paste the resulting chart. \# R Code pie(table(fortunescompanyitype)) g) Now, make a basic scatterplot of revenue vs. market.value. Copy/paste the resulting plot. Describe what you observe about the relationship between revenue and marketvalue in a couple sentences. \# R Code plot(fortunesmarket.value, fortunesrevenue) 11111111111111111111111111111111111 1