Question
14) Russell Container Corporation has a $1,000 par value bond outstanding with 30 years to maturity. The bond carries an annual interest payment of $120
14)
Russell Container Corporation has a $1,000 par value bond outstanding with 30 years to maturity. The bond carries an annual interest payment of $120 and is currently selling for $820 per bond. Russell Corp. is in a 40 percent tax bracket. The firm wishes to know what the aftertax cost of a new bond issue is likely to be. The yield to maturity on the new issue will be the same as the yield to maturity on the old issue because the risk and maturity date will be similar.
a. Compute the yield to maturity on the old issue and use this as the yield for the new issue. (Do not round intermediate calculations. Input your answer as a percent rounded to 2 decimal places.)
b. Make the appropriate tax adjustment to determine the aftertax cost of debt. (Do not round intermediate calculations. Input your answer as a percent rounded to 2 decimal places.)
15)
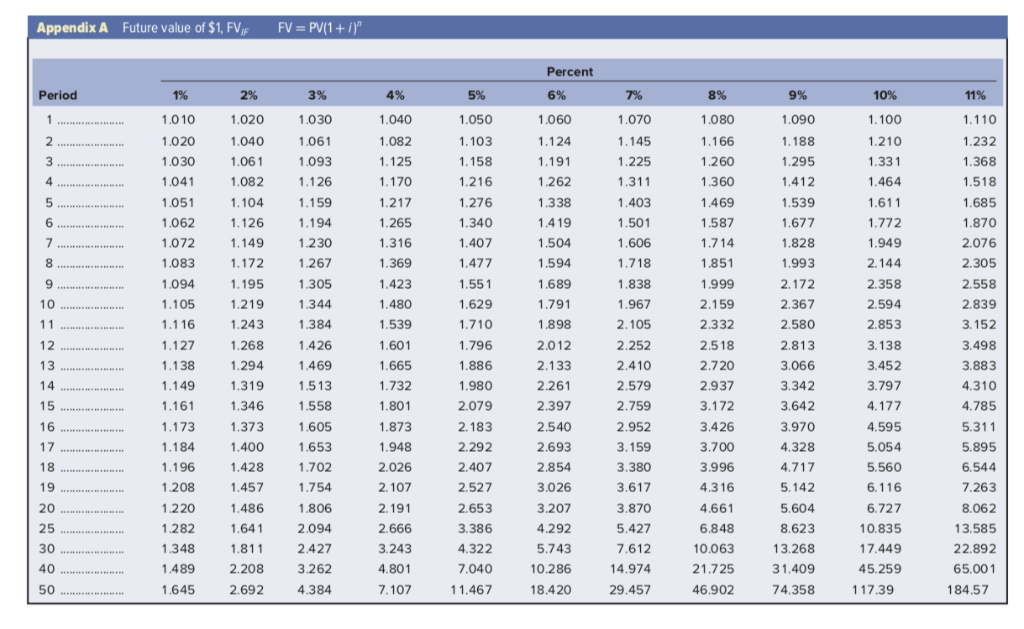
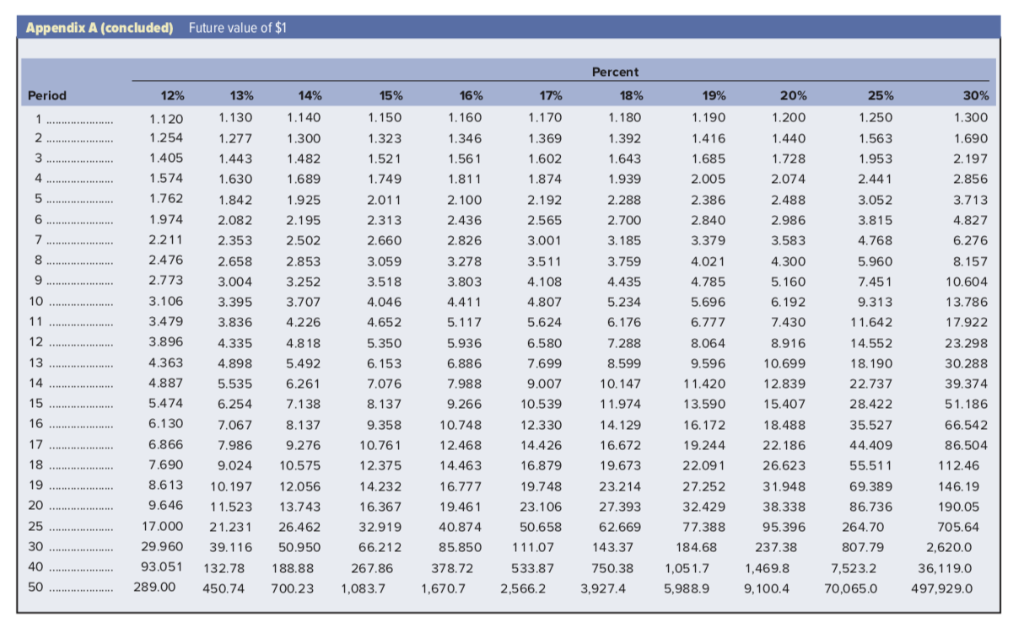
Turner Video will invest $78,500 in a project. The firms cost of capital is 14 percent. The investment will provide the following inflows. Use Appendix A for an approximate answer but calculate your final answer using the formula and financial calculator methods.
| Year | Inflow | ||
| 1 | $ | 25,000 | |
| 2 | 27,000 | ||
| 3 | 31,000 | ||
| 4 | 35,000 | ||
| 5 | 39,000 | ||
The internal rate of return is 18 percent.
a. If the reinvestment assumption of the net present value method is used, what will be the total value of the inflows after five years? (Assume the inflows come at the end of each year.) (Do not round intermediate calculations and round your answer to 2 decimal places.)
b. If the reinvestment assumption of the internal rate of return method is used, what will be the total value of the inflows after five years? (Use the given internal rate of return. Do not round intermediate calculations and round your answer to 2 decimal places.)
c. Which investment assumption is better?
-
Reinvestment assumption of IRR
-
Reinvestment assumption of NPV
17)
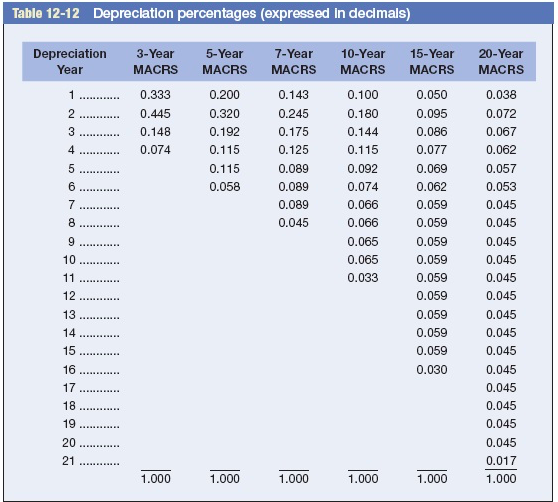
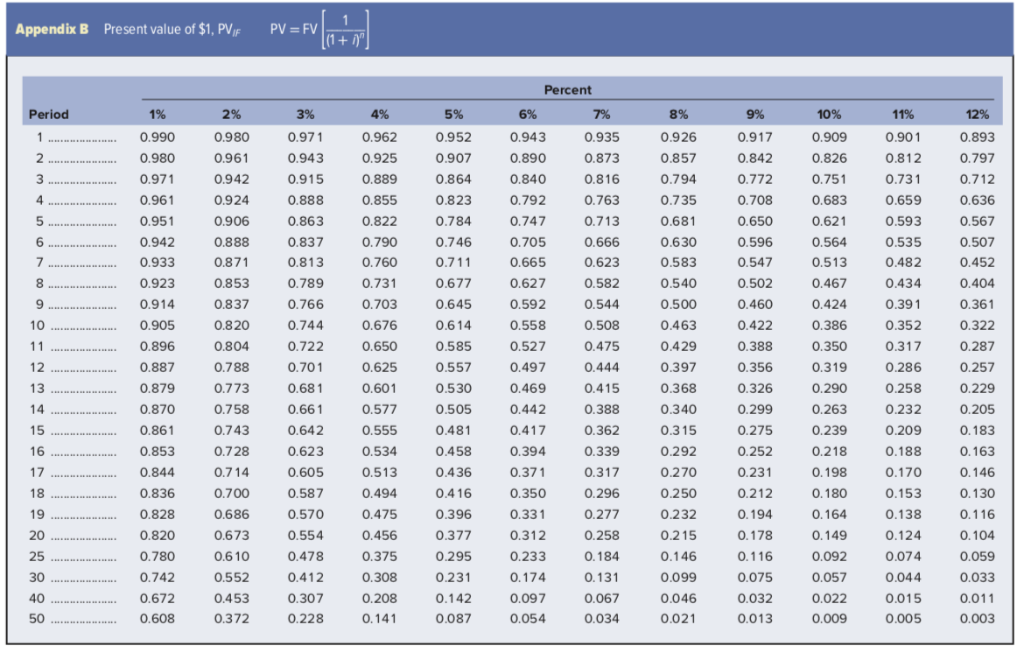
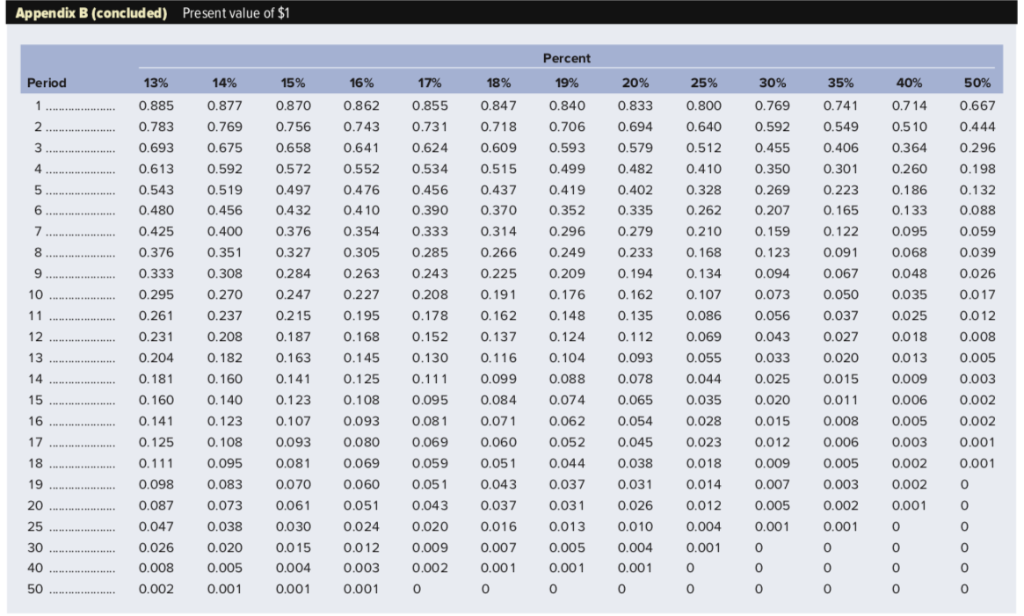
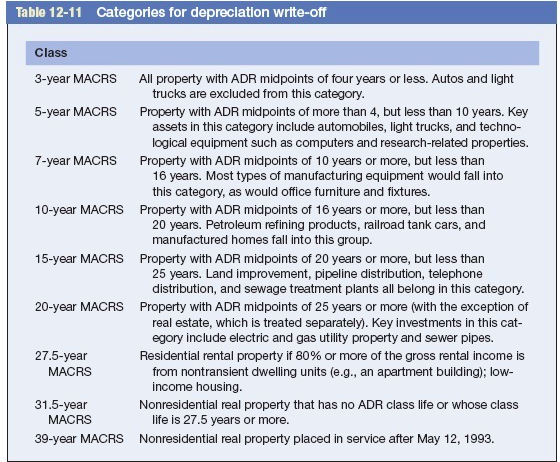
Hercules Exercise Equipment Co. purchased a computerized measuring device two years ago for $80,000. The equipment falls into the five-year category for MACRS depreciation and can currently be sold for $35,800. A new piece of equipment will cost $240,000. It also falls into the five-year category for MACRS depreciation. Assume the new equipment would provide the following stream of added cost savings for the next six years. Use Table 1212. Use Appendix B for an approximate answer but calculate your final answer using the formula and financial calculator methods.
| Year | Cash Savings | |||
| 1 | $ | 62,000 | ||
| 2 | 52,000 | |||
| 3 | 50,000 | |||
| 4 | 48,000 | |||
| 5 | 45,000 | |||
| 6 | 34,000 | |||
The firms tax rate is 25 percent and the cost of capital is 9 percent.
a. What is the book value of the old equipment? (Do not round intermediate calculations and round your answer to the nearest whole dollar.)
b. What is the tax loss on the sale of the old equipment? (Do not round intermediate calculations and round your answer to the nearest whole dollar.)
c. What is the tax benefit from the sale? (Do not round intermediate calculations and round your answer to the nearest whole dollar.)
d. What is the cash inflow from the sale of the old equipment? (Do not round intermediate calculations and round your answer to the nearest whole dollar.)
e. What is the net cost of the new equipment? (Include the inflow from the sale of the old equipment.) (Do not round intermediate calculations and round your answer to the nearest whole dollar.)
f. Determine the depreciation schedule for the new equipment. (Round the depreciation base and annual depreciation answers to the nearest whole dollar. Round the percentage depreciation factors to 3 decimal places.)
g. Determine the depreciation schedule for the remaining years of the old equipment. (Round the depreciation base and annual depreciation answers to the nearest whole dollar. Round the percentage depreciation factors to 3 decimal places.)
h. Determine the incremental depreciation between the old and new equipment and the related tax shield benefits. (Enter the tax rate as a decimal rounded to 2 decimal places. Round all other answers to the nearest whole dollar.)
i. Compute the aftertax benefits of the cost savings. (Enter the aftertax factor as a decimal rounded to 2 decimal places. Round all other answers to the nearest whole dollar.)
j-1. Add the depreciation tax shield benefits and the aftertax cost savings to determine the total annual benefits. (Do not round intermediate calculations and round your answers to the nearest whole dollar.)
j-2. Compute the present value of the total annual benefits. (Do not round intermediate calculations and round your answer to the nearest whole dollar.)
k-1. Compare the present value of the incremental benefits (j) to the net cost of the new equipment (e). (Do not round intermediate calculations. Negative amount should be indicated by a minus sign. Round your answer to the nearest whole dollar.)
k-2. Should the replacement be undertaken?
23)
X-treme Vitamin Company is considering two investments, both of which cost $48,000. The cash flows are as follows:
| Year | Project A | Project B | ||||
| 1 | $ | 52,000 | $ | 48,000 | ||
| 2 | 21,000 | 25,000 | ||||
| 3 | 20,000 | 26,000 | ||||
Use Appendix B for an approximate answer but calculate your final answer using the formula and financial calculator methods.
a-1. Calculate the payback period for Project A and Project B. (Round your answers to 2 decimal places.)
a-2. Which of the two projects should be chosen based on the payback method?
-
Project A
-
Project B
b-1. Calculate the net present value for Project A and Project B. Assume a cost of capital of 8 percent. (Do not round intermediate calculations and round your final answers to 2 decimal places.)
27)
DataPoint Engineering is considering the purchase of a new piece of equipment for $200,000. It has an eight-year midpoint of its asset depreciation range (ADR). It will require an additional initial investment of $100,000 in nondepreciable working capital. Twenty-five thousand dollars of this investment will be recovered after the sixth year and will provide additional cash flow for that year. Income before depreciation and taxes for the next six are shown in the following table. Use Table 1211, Table 1212. Use Appendix B for an approximate answer but calculate your final answer using the formula and financial calculator methods.
| Year | Amount | ||||
| 1 | $ | 173,000 | |||
| 2 | 152,000 | ||||
| 3 | 108,000 | ||||
| 4 | 103,000 | ||||
| 5 | 89,000 | ||||
| 6 | 71,000 | ||||
The tax rate is 25 percent. The cost of capital must be computed based on the following:
| Cost (aftertax) | Weights | ||||||||
| Debt | Kd | 5.50 | % | 30 | % | ||||
| Preferred stock | Kp | 9.20 | 10 | ||||||
| Common equity (retained earnings) | Ke | 14.00 | 60 | ||||||
a. Determine the annual depreciation schedule. (Do not round intermediate calculations. Round your depreciation base and annual depreciation answers to the nearest whole dollar. Round your percentage depreciation answers to 3 decimal places.)
b. Determine the annual cash flow for each year. Be sure to include the recovered working capital in Year 6. (Do not round intermediate calculations and round your answers to 2 decimal places.)
c. Determine the weighted average cost of capital. (Do not round intermediate calculations. Enter your answer as a percent rounded to 2 decimal places.)
d-1. Determine the net present value. (Use the WACC from part c rounded to 2 decimal places as a percent as the cost of capital (e.g., 12.34%). Do not round any other intermediate calculations. Round your answer to 2 decimal places.)
Step by Step Solution
There are 3 Steps involved in it
Step: 1

Get Instant Access to Expert-Tailored Solutions
See step-by-step solutions with expert insights and AI powered tools for academic success
Step: 2

Step: 3

Ace Your Homework with AI
Get the answers you need in no time with our AI-driven, step-by-step assistance
Get Started


