Answered step by step
Verified Expert Solution
Link Copied!

Question

1 Approved Answer

14. The table below shows the number of live births by a mother 50 - 54 years old who had a live birth in 2017.
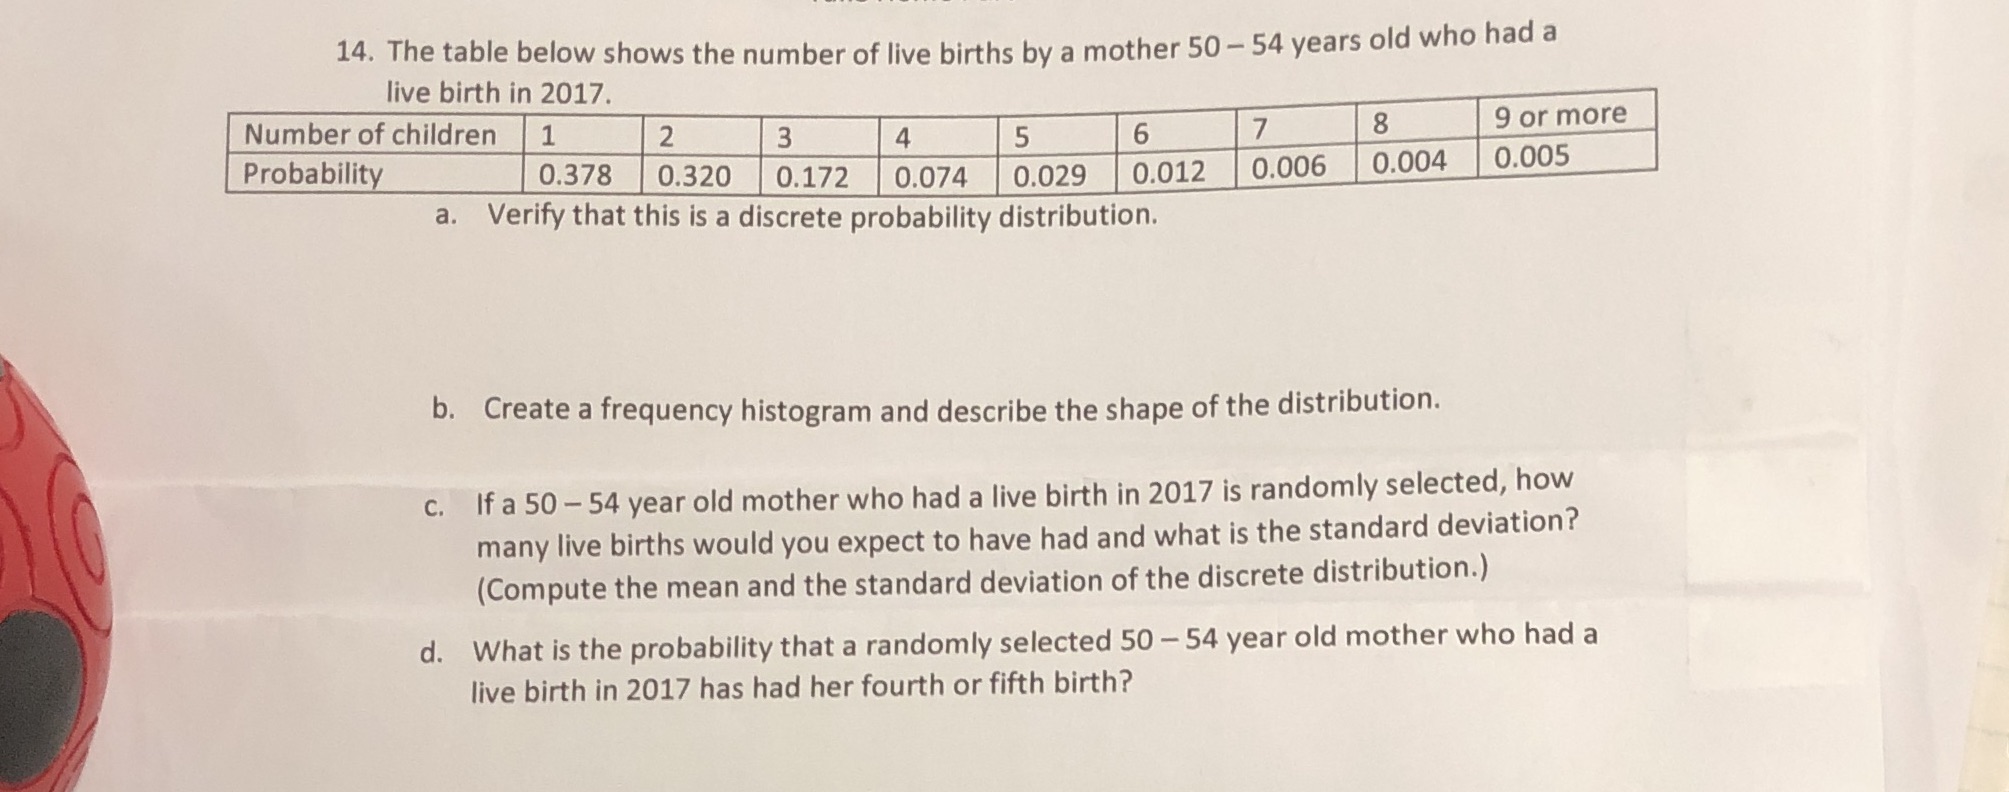
image text in transcribed
14. The table below shows the number of live births by a mother 50 - 54 years old who had a live birth in 2017. Number of children 1 2 3 4 5 6 7 8 9 or more Probability 0.378 0.320 0.172 0.074 0.029 0.012 0.006 0.004 0.005 a. Verify that this is a discrete probability distribution. b. Create a frequency histogram and describe the shape of the distribution. c. If a 50 - 54 year old mother who had a live birth in 2017 is randomly selected, how many live births would you expect to have had and what is the standard deviation? (Compute the mean and the standard deviation of the discrete distribution.) d. What is the probability that a randomly selected 50 - 54 year old mother who had a live birth in 2017 has had her fourth or fifth birth

Step by Step Solution

There are 3 Steps involved in it

Step: 1

blur-text-image

Get Instant Access to Expert-Tailored Solutions

See step-by-step solutions with expert insights and AI powered tools for academic success

Step: 2

blur-text-image

Step: 3

blur-text-image

Ace Your Homework with AI

Get the answers you need in no time with our AI-driven, step-by-step assistance

Get Started

Recommended Textbook for

Finite Math And Applied Calculus

Authors: Stefan Waner, Steven Costenoble

2nd Edition

0534366309, 9780534366308

More Books

Students also viewed these Mathematics questions