Answered step by step
Verified Expert Solution
Link Copied!

Question

1 Approved Answer

14. Use the data that shows the ages of the U.S. population to create a histogram. Tell whether the data is positively skewed, negatively skewed,
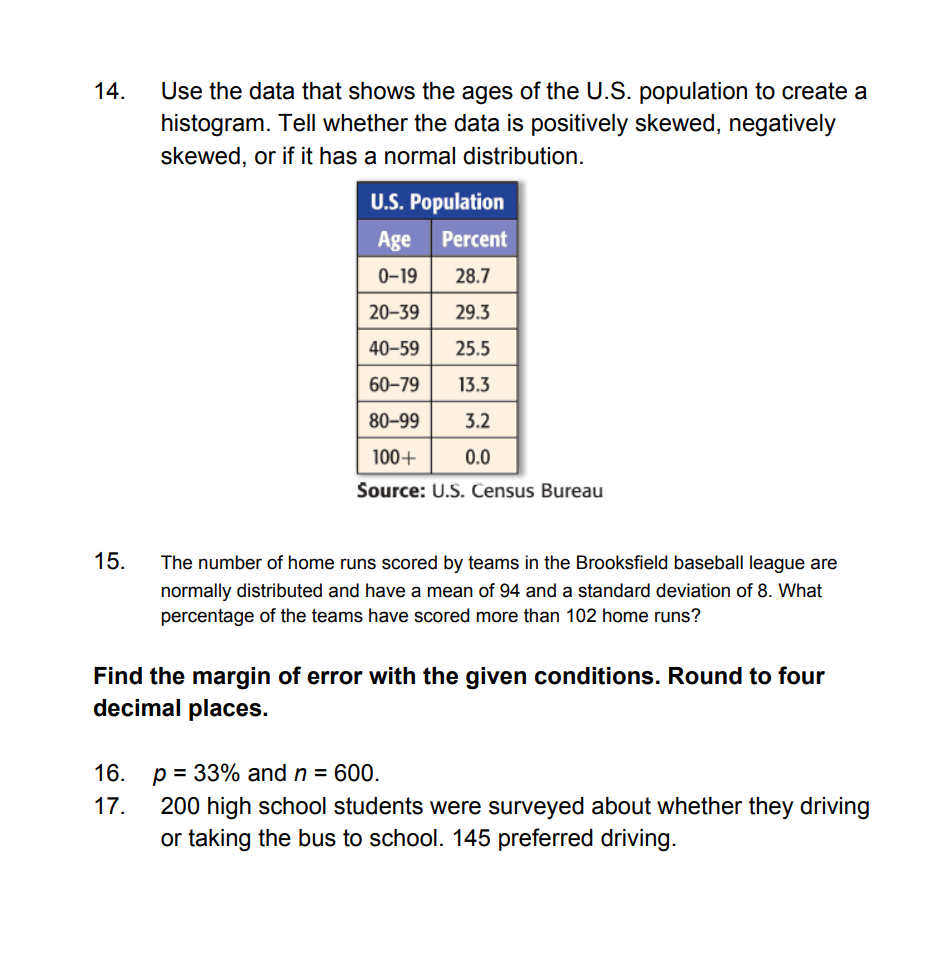
image text in transcribed
14. Use the data that shows the ages of the U.S. population to create a histogram. Tell whether the data is positively skewed, negatively skewed, or if it has a normal distribution. U.S. Population Age Percent 0-19 28.7 20-39 29.3 40-59 25.5 60-79 13.3 80-99 3.2 100+ 0.0 Source: U.S. Census Bureau 15. The number of home runs scored by teams in the Brooksfield baseball league are normally distributed and have a mean of 94 and a standard deviation of 8. What percentage of the teams have scored more than 102 home runs? Find the margin of error with the given conditions. Round to four decimal places 16. p = 33% and n = 600. 17. 200 high school students were surveyed about whether they driving or taking the bus to school. 145 preferred driving

Step by Step Solution

There are 3 Steps involved in it

Step: 1

blur-text-image

Get Instant Access to Expert-Tailored Solutions

See step-by-step solutions with expert insights and AI powered tools for academic success

Step: 2

blur-text-image

Step: 3

blur-text-image

Ace Your Homework with AI

Get the answers you need in no time with our AI-driven, step-by-step assistance

Get Started

Recommended Textbook for

Linear Algebra and Its Applications

Authors: Gilbert Strang

4th edition

30105678, 30105676, 978-0030105678

More Books

Students also viewed these Mathematics questions