

Question
14. What is the overall message/story that these graphs collectively depict about the cases and deaths from COVID-19 in King County? (2 points) 15. In
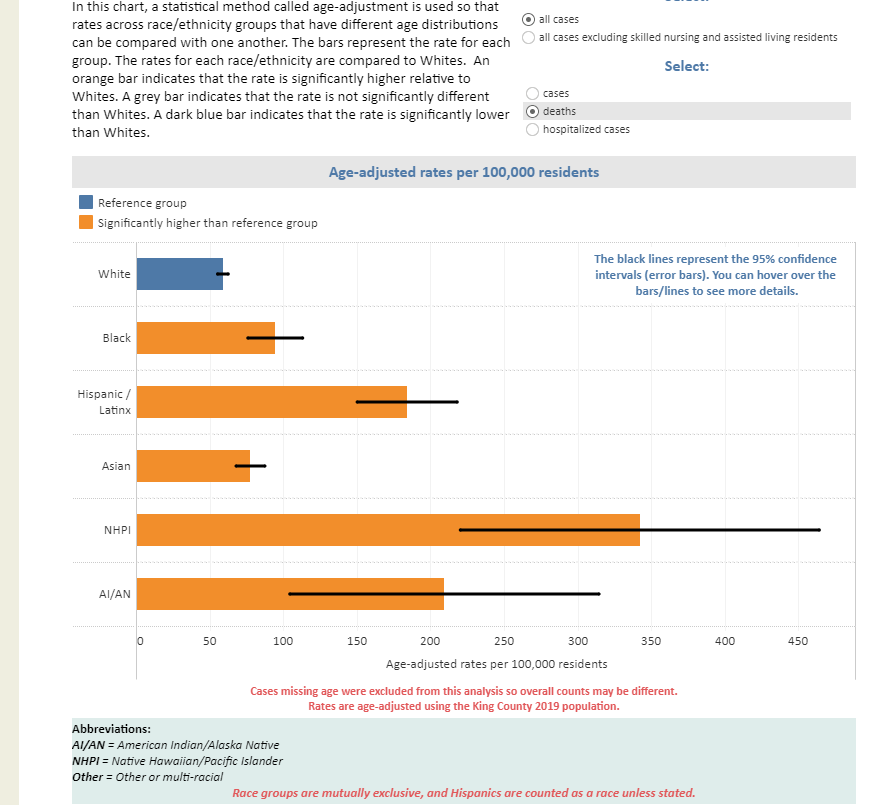
14. What is the overall message/story that these graphs collectively depict about the cases and deaths from COVID-19 in King County? (2 points)
15. In both COVID-19 cases and deaths data in King County, which race/ethnic group has the most accuracy in its estimate and which race/ethnic group has the least accuracy in its estimate? (2 points)
Step by Step Solution
There are 3 Steps involved in it
Step: 1

Get Instant Access to Expert-Tailored Solutions
See step-by-step solutions with expert insights and AI powered tools for academic success
Step: 2

Step: 3
Ace Your Homework with AI
Get the answers you need in no time with our AI-driven, step-by-step assistance
Get Started
Algebra And Trigonometry Enhanced With Graphing Utilities (Subscription)
Authors: Michael, Michael Sullivan III, Michael III Sullivan, Michael Sullivan 111, III Sullivan
6th Edition
0321849132, 9780321849137