Answered step by step
Verified Expert Solution
Link Copied!

Question

1 Approved Answer

14.13 Fit an exponential model to r 0.4 0.8 12 1.6 2.3 y 800 985 1490 1950 2850 3600 Plot the data and the equation
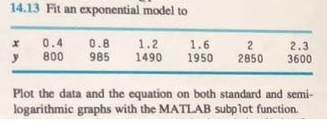
image text in transcribed

14.13 Fit an exponential model to r 0.4 0.8 12 1.6 2.3 y 800 985 1490 1950 2850 3600 Plot the data and the equation on both standard and semi- logarithmic graphs with the MATLAB subplot function

Step by Step Solution

There are 3 Steps involved in it

Step: 1

blur-text-image

Get Instant Access to Expert-Tailored Solutions

See step-by-step solutions with expert insights and AI powered tools for academic success

Step: 2

blur-text-image

Step: 3

blur-text-image

Ace Your Homework with AI

Get the answers you need in no time with our AI-driven, step-by-step assistance

Get Started

Recommended Textbook for

Machine Learning And Knowledge Discovery In Databases European Conference Ecml Pkdd 2014 Nancy France September 15 19 2014 Proceedings Part 2 Lnai 8725

Authors: Toon Calders ,Floriana Esposito ,Eyke Hullermeier ,Rosa Meo

2014th Edition

3662448505, 978-3662448502

More Books

Students also viewed these Databases questions