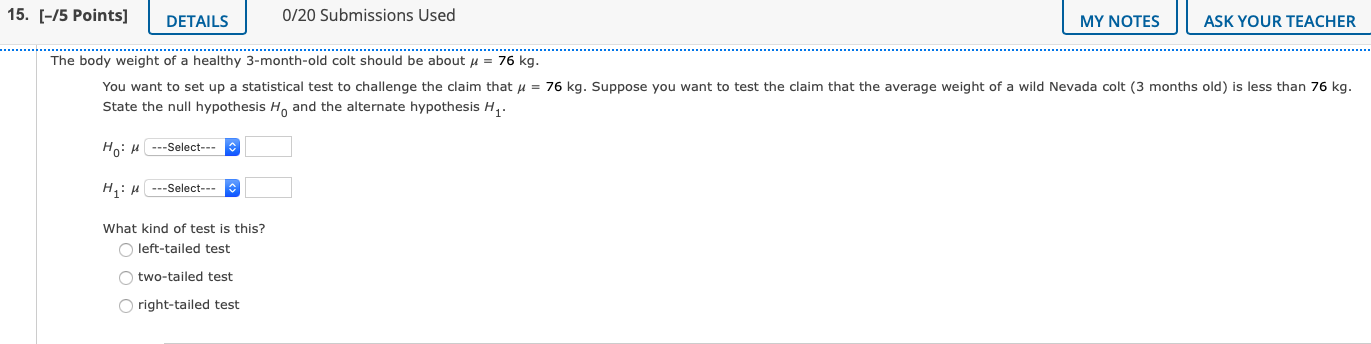
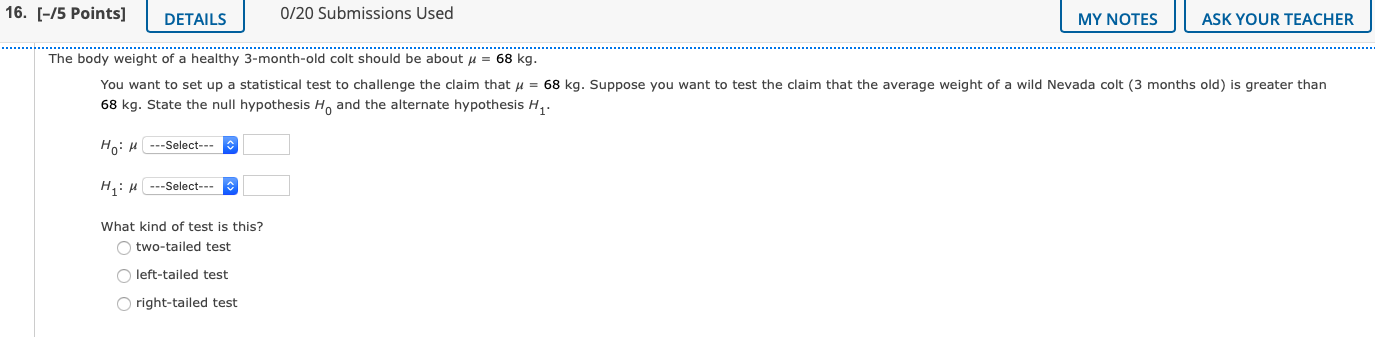
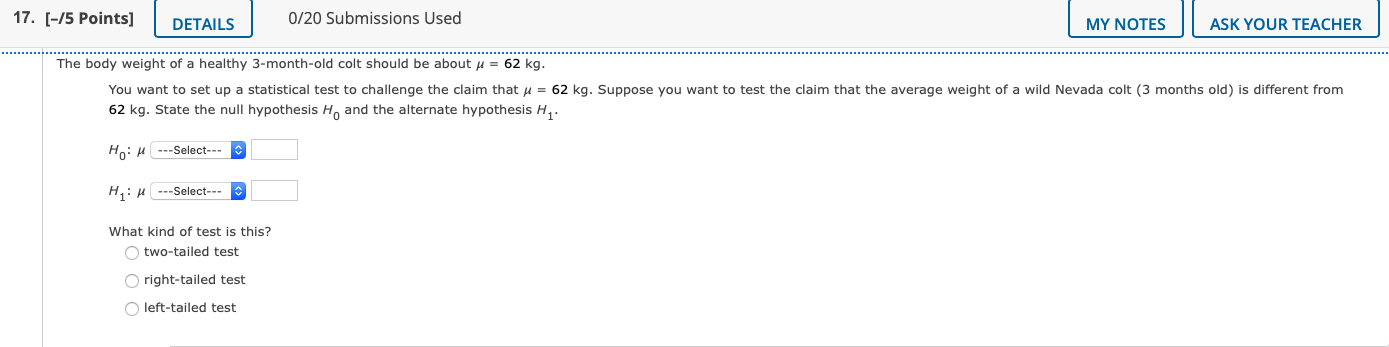
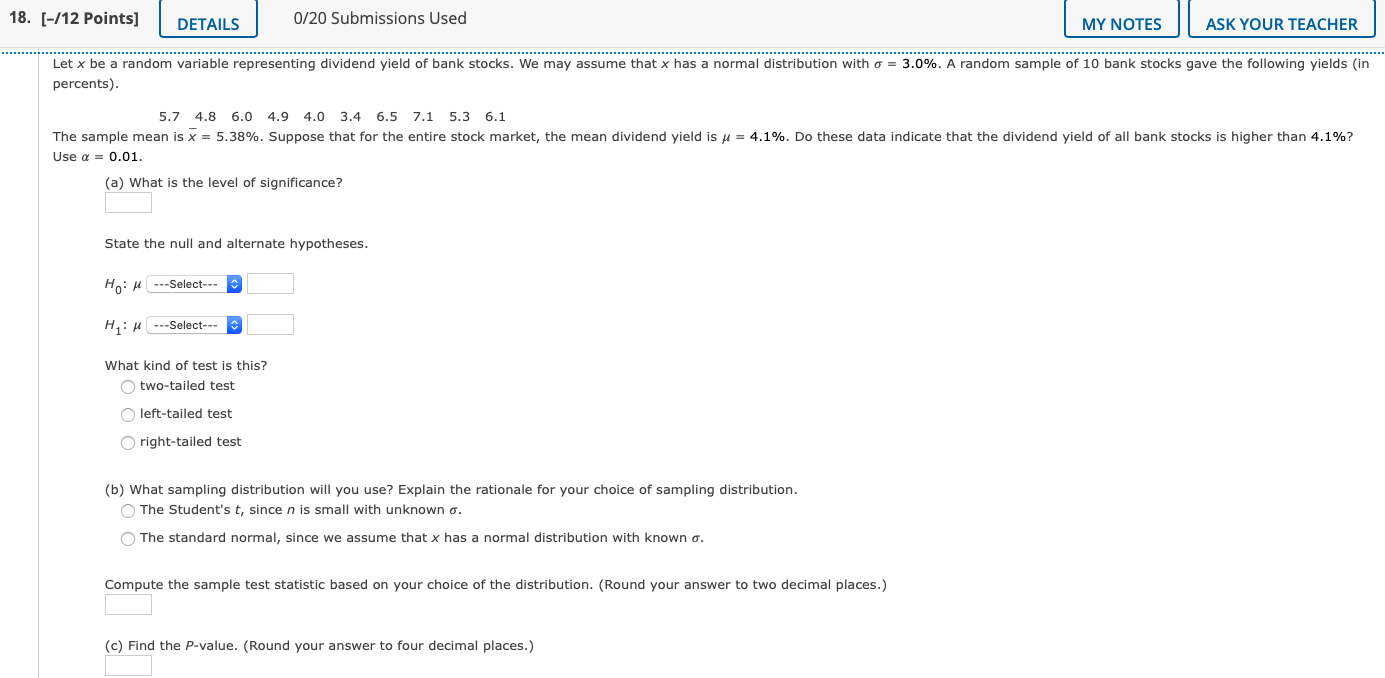
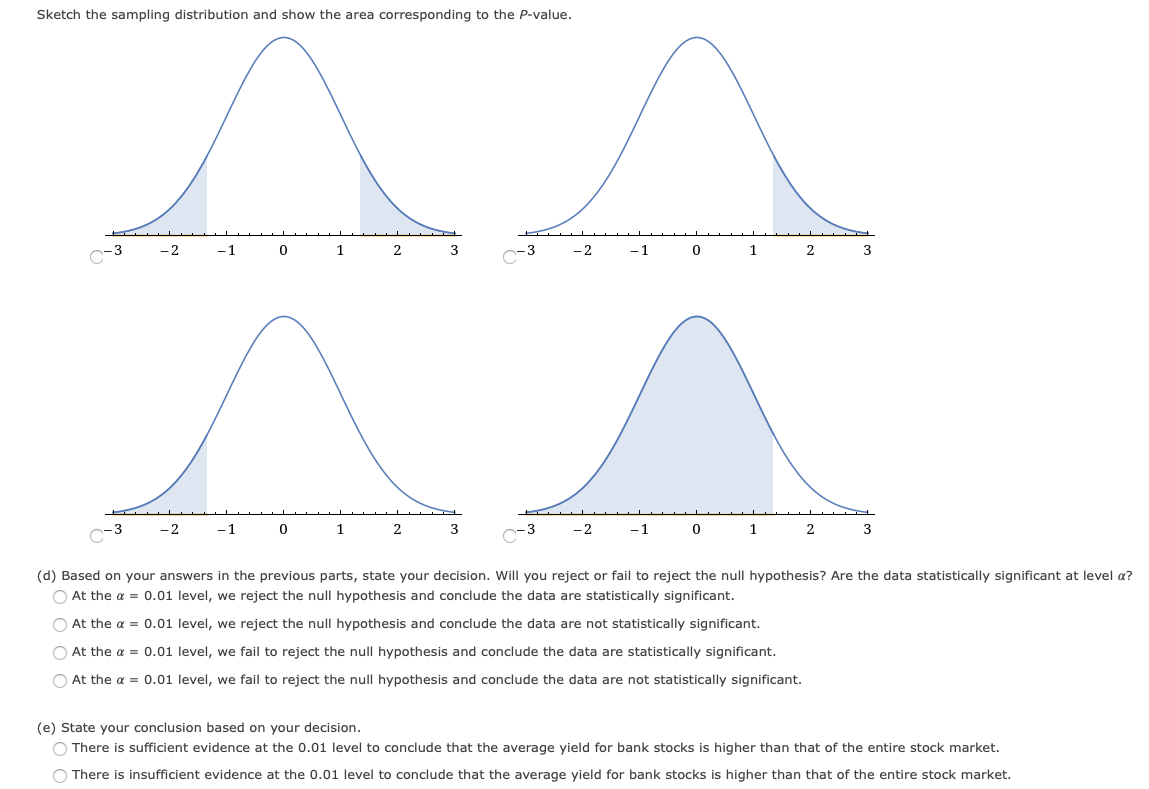
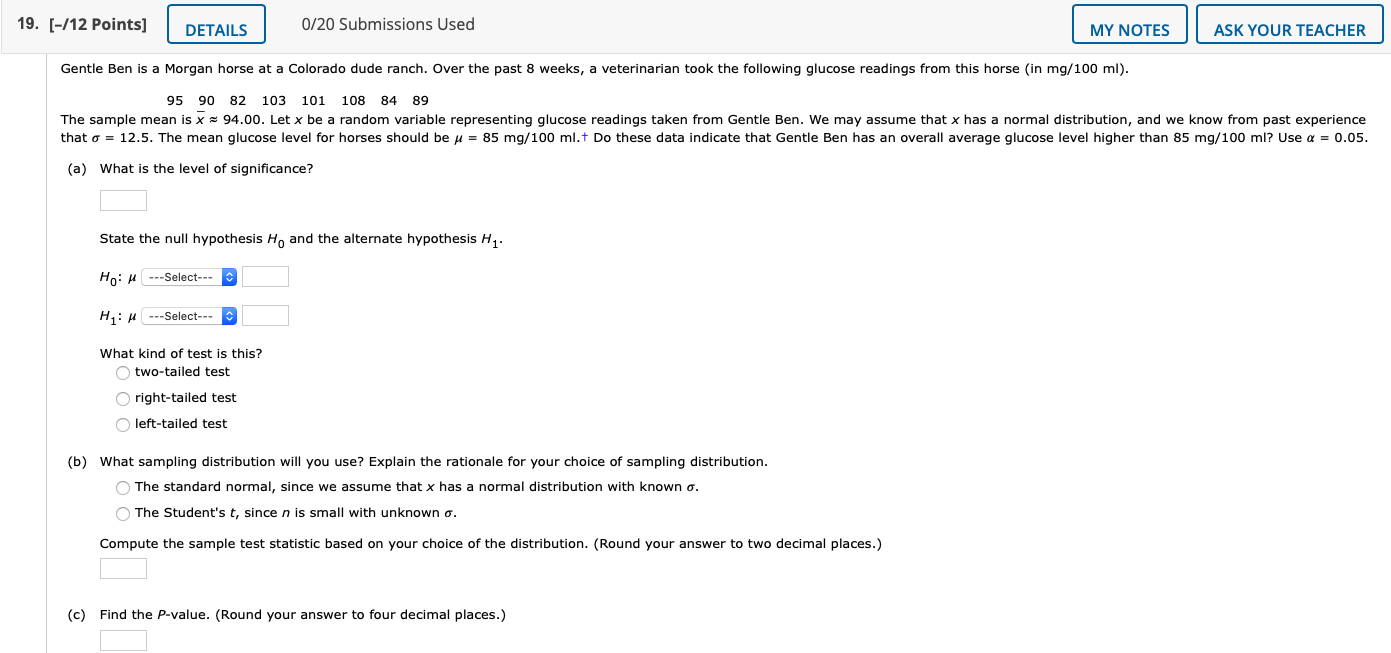
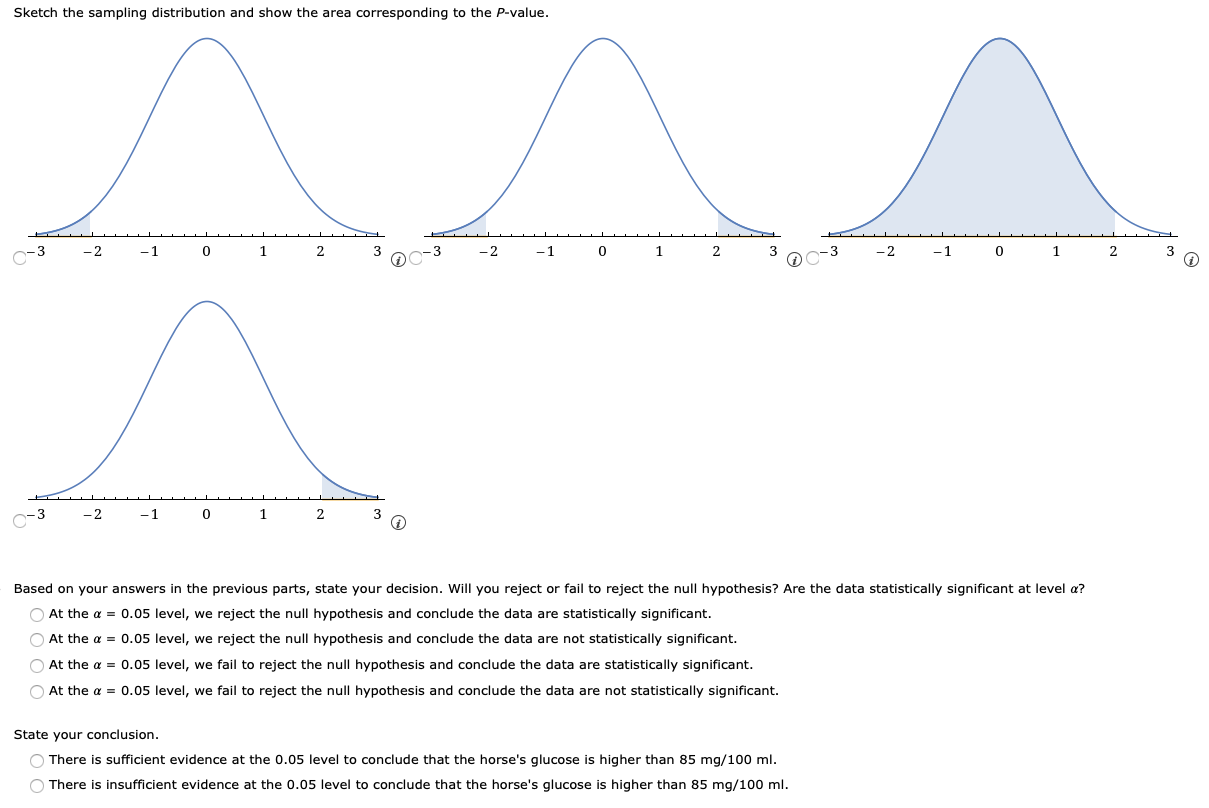
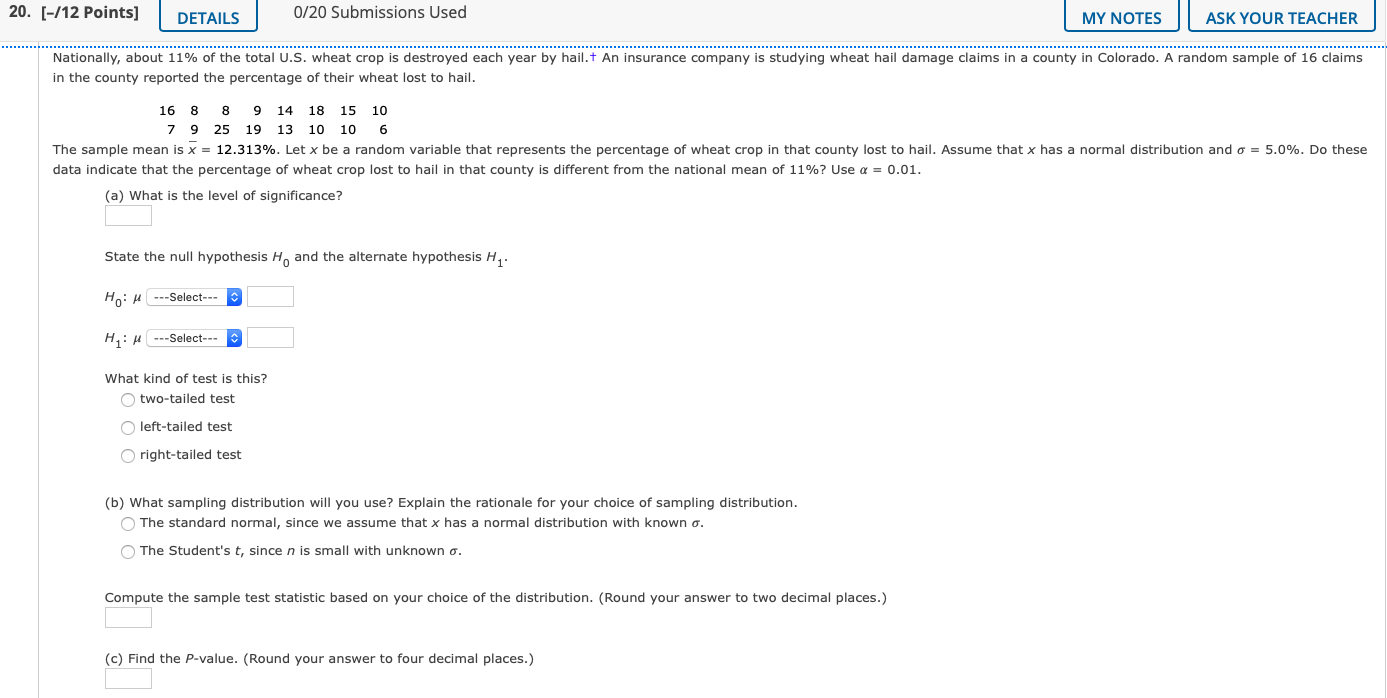
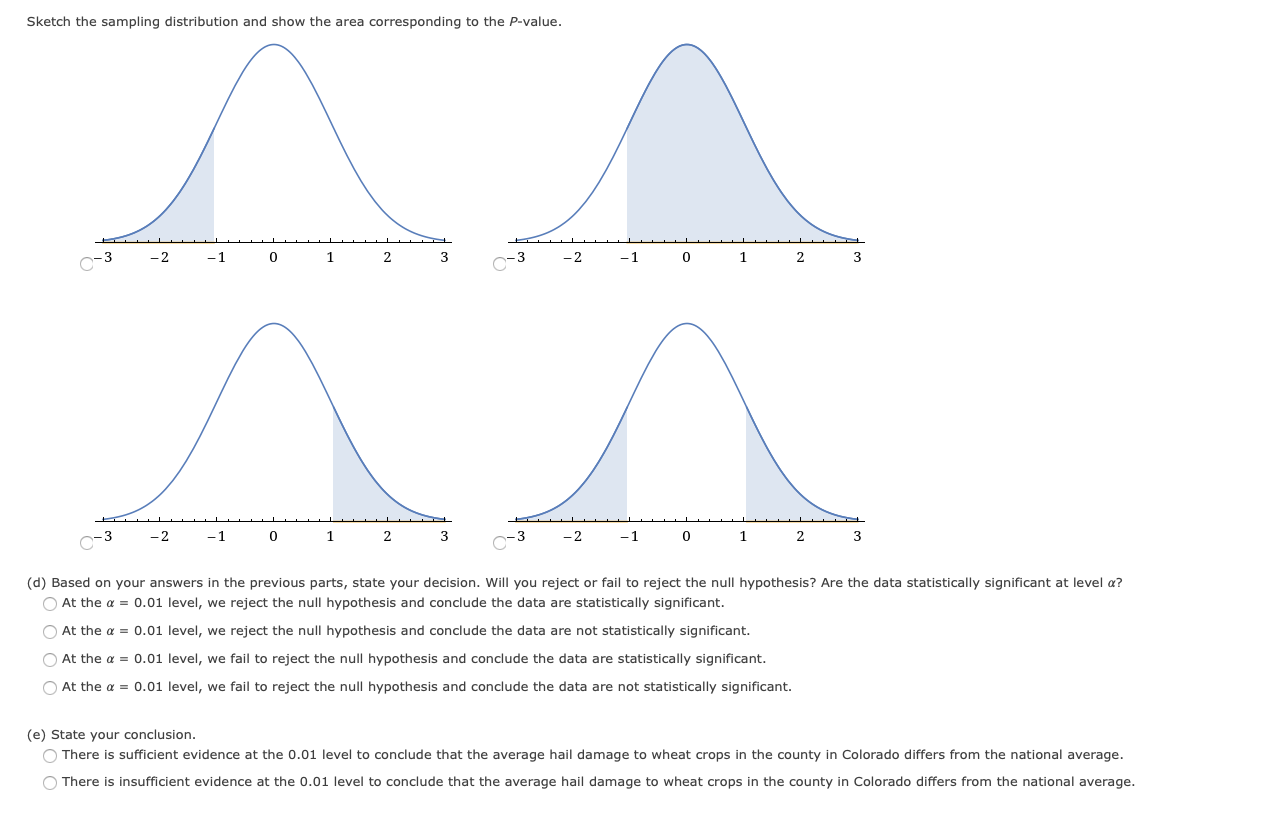
15. [-/5 Points] DETAILS 0/20 Submissions Used MY NOTES ASK YOUR TEACHER The body weight of a healthy 3-month-old colt should be about # = 76 kg. You want to set up a statistical test to challenge the claim that / = 76 kg. Suppose you want to test the claim that the average weight of a wild Nevada colt (3 months old) is less than 76 kg. State the null hypothesis Ho and the alternate hypothesis H1- Ho: H ---Select--- H: H ---Select--- E What kind of test is this? left-tailed test O two-tailed test O right-tailed test16. [-/5 Points] DETAILS 0/20 Submissions Used MY NOTES ASK YOUR TEACHER The body weight of a healthy 3-month-old colt should be about # = 68 kg. You want to set up a statistical test to challenge the claim that , = 68 kg. Suppose you want to test the claim that the average weight of a wild Nevada colt (3 months old) is greater than 68 kg. State the null hypothesis Ho and the alternate hypothesis H1 Ho: M ---Select--- E H : H ---Select--- What kind of test is this? O two-tailed test left-tailed test O right-tailed test17. [-/5 Points] DETAILS 0/20 Submissions Used MY NOTES ASK YOUR TEACHER The body weight of a healthy 3-month-old colt should be about # = 62 kg. You want to set up a statistical test to challenge the claim that / = 62 kg. Suppose you want to test the claim that the average weight of a wild Nevada colt (3 months old) is different from 62 kg. State the null hypothesis Ho and the alternate hypothesis H1. Ho: H ---Select--- C H: M ---Select--- What kind of test is this? O two-tailed test O right-tailed test O left-tailed test18. [-/12 Points] DETAILS 0/20 Submissions Used MY NOTES ASK YOUR TEACHER Let x be a random variable representing dividend yield of bank stocks. We may assume that x has a normal distribution with o = 3.0%. A random sample of 10 bank stocks gave the following yields (in percents). 5.7 4.8 6.0 4.9 4.0 3.4 6.5 7.1 5.3 6.1 The sample mean is x = 5.38%. Suppose that for the entire stock market, the mean dividend yield is # = 4.1%. Do these data indicate that the dividend yield of all bank stocks is higher than 4.1%? Use a = 0.01. (a) What is the level of significance? State the null and alternate hypotheses. Ho: H ---Select--- H: M ---Select--- E What kind of test is this? O two-tailed test left-tailed test O right-tailed test (b) What sampling distribution will you use? Explain the rationale for your choice of sampling distribution. The Student's t, since n is small with unknown o. The standard normal, since we assume that x has a normal distribution with known o. Compute the sample test statistic based on your choice of the distribution. (Round your answer to two decimal places.) (c) Find the P-value. (Round your answer to four decimal places.)Sketch the sampling distribution and show the area corresponding to the -value. O-3 -2 - 1 0 1 2 3 O-3 -2 -1 0 1 2 3 -3 -2 - 1 1 2 -3 -2 -1 1 2 (d) Based on your answers in the previous parts, state your decision. Will you reject or fail to reject the null hypothesis? Are the data statistically significant at level a? O At the a = 0.01 level, we reject the null hypothesis and conclude the data are statistically significant. At the a = 0.01 level, we reject the null hypothesis and conclude the data are not statistically significant. At the a = 0.01 level, we fail to reject the null hypothesis and conclude the data are statistically significant. At the a = 0.01 level, we fail to reject the null hypothesis and conclude the data are not statistically significant. (e) State your conclusion based on your decision. There is sufficient evidence at the 0.01 level to conclude that the average yield for bank stocks is higher than that of the entire stock market. O There is insufficient evidence at the 0.01 level to conclude that the average yield for bank stocks is higher than that of the entire stock market.19. [-/12 Points] DETAILS 0/20 Submissions Used MY NOTES ASK YOUR TEACHER Gentle Ben is a Morgan horse at a Colorado dude ranch. Over the past 8 weeks, a veterinarian took the following glucose readings from this horse (in mg/100 ml). 95 90 82 103 101 108 84 89 The sample mean is x = 94.00. Let x be a random variable representing glucose readings taken from Gentle Ben. We may assume that x has a normal distribution, and we know from past experience that o = 12.5. The mean glucose level for horses should be # = 85 mg/100 ml.t Do these data indicate that Gentle Ben has an overall average glucose level higher than 85 mg/100 ml? Use a = 0.05. (a) What is the level of significance? State the null hypothesis Ho and the alternate hypothesis H1- Ho: H ---Select--- E H1: H ---Select--- E What kind of test is this? two-tailed test O right-tailed test O left-tailed test (b) What sampling distribution will you use? Explain the rationale for your choice of sampling distribution. O The standard normal, since we assume that x has a normal distribution with known o. The Student's t, since n is small with unknown o. Compute the sample test statistic based on your choice of the distribution. (Round your answer to two decimal places.) (c) Find the P-value. (Round your answer to four decimal places.)Sketch the sampling distribution and show the area corresponding to the P-value. O-3 - 2 -1 0 1 2 3 0 0-3 -2 - 1 0 1 2 -2 -1 0 1 2 3 1 O-3 -2 -1 0 1 2 3 Based on your answers in the previous parts, state your decision. Will you reject or fail to reject the null hypothesis? Are the data statistically significant at level a? At the a = 0.05 level, we reject the null hypothesis and conclude the data are statistically significant. At the a = 0.05 level, we reject the null hypothesis and conclude the data are not statistically significant. At the a = 0.05 level, we fail to reject the null hypothesis and conclude the data are statistically significant. O At the a = 0.05 level, we fail to reject the null hypothesis and conclude the data are not statistically significant. State your conclusion. There is sufficient evidence at the 0.05 level to conclude that the horse's glucose is higher than 85 mg/100 ml. There is insufficient evidence at the 0.05 level to conclude that the horse's glucose is higher than 85 mg/100 ml.20. [-/12 Points] DETAILS 0/20 Submissions Used MY NOTES ASK YOUR TEACHER Nationally, about 11% of the total U.S. wheat crop is destroyed each year by hail. An insurance company is studying wheat hail damage claims in a county in Colorado. A random sample of 16 claims in the county reported the percentage of their wheat lost to hail. 16 8 8 14 18 15 10 7 9 2 25 19 13 10 10 6 The sample mean is x = 12.313%. Let x be a random variable that represents the percentage of wheat crop in that county lost to hail. Assume that x has a normal distribution and o = 5.0%. Do these data indicate that the percentage of wheat crop lost to hail in that county is different from the national mean of 11%? Use a = 0.01. (a) What is the level of significance? State the null hypothesis H and the alternate hypothesis H. Ho: M ---Select--- E H: H ---Select--- What kind of test is this? O two-tailed test O left-tailed test O right-tailed test (b) What sampling distribution will you use? Explain the rationale for your choice of sampling distribution. O The standard normal, since we assume that x has a normal distribution with known a. O The Student's t, since n is small with unknown o. Compute the sample test statistic based on your choice of the distribution. (Round your answer to two decimal places.) (c) Find the P-value. (Round your answer to four decimal places.)Sketch the sampling distribution and show the area corresponding to the P-value. O-3 -2 - 1 0 1 2 3 O-3 -2 - 1 0 1 2 3 -3 - 2 - 1 0 1 2 3 -3 -2 - 1 0 1 2 3 (d) Based on your answers in the previous parts, state your decision. Will you reject or fail to reject the null hypothesis? Are the data statistically significant at level a? At the a = 0.01 level, we reject the null hypothesis and conclude the data are statistically significant. At the a = 0.01 level, we reject the null hypothesis and conclude the data are not statistically significant. At the a = 0.01 level, we fail to reject the null hypothesis and conclude the data are statistically significant. O At the a = 0.01 level, we fail to reject the null hypothesis and conclude the data are not statistically significant. (e) State your conclusion. There is sufficient evidence at the 0.01 level to conclude that the average hail damage to wheat crops in the county in Colorado differs from the national average. There is insufficient evidence at the 0.01 level to conclude that the average hail damage to wheat crops in the county in Colorado differs from the national average