Answered step by step
Verified Expert Solution
Question
1 Approved Answer
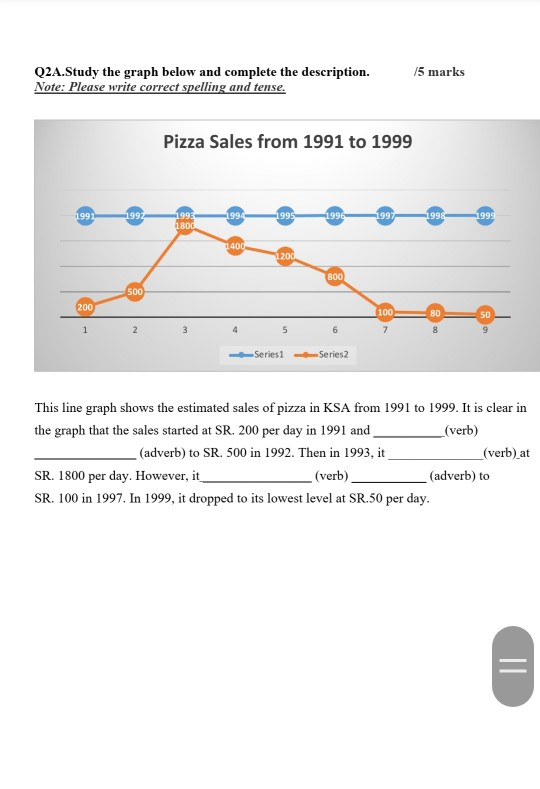
15 marks Q2A.Study the graph below and complete the description. Note: Please write correct spelling and tense. Pizza Sales from 1991 to 1999 Series Series2

15 marks Q2A.Study the graph below and complete the description. Note: Please write correct spelling and tense. Pizza Sales from 1991 to 1999 Series Series2 This line graph shows the estimated sales of pizza in KSA from 1991 to 1999. It is clear in the graph that the sales started at SR. 200 per day in 1991 and (verb) (adverb) to SR. 500 in 1992. Then in 1993, it _(verb) at SR. 1800 per day. However, it (verb) (adverb) to SR. 100 in 1997. In 1999, it dropped to its lowest level at SR.50 per day
Step by Step Solution
There are 3 Steps involved in it
Step: 1

Get Instant Access to Expert-Tailored Solutions
See step-by-step solutions with expert insights and AI powered tools for academic success
Step: 2

Step: 3

Ace Your Homework with AI
Get the answers you need in no time with our AI-driven, step-by-step assistance
Get Started


