Answered step by step
Verified Expert Solution
Link Copied!

Question

1 Approved Answer

[15 points] Find the condition number of f(x)=1+2x11+x1x, simplify as much as you can, and study for what values of x in R the function
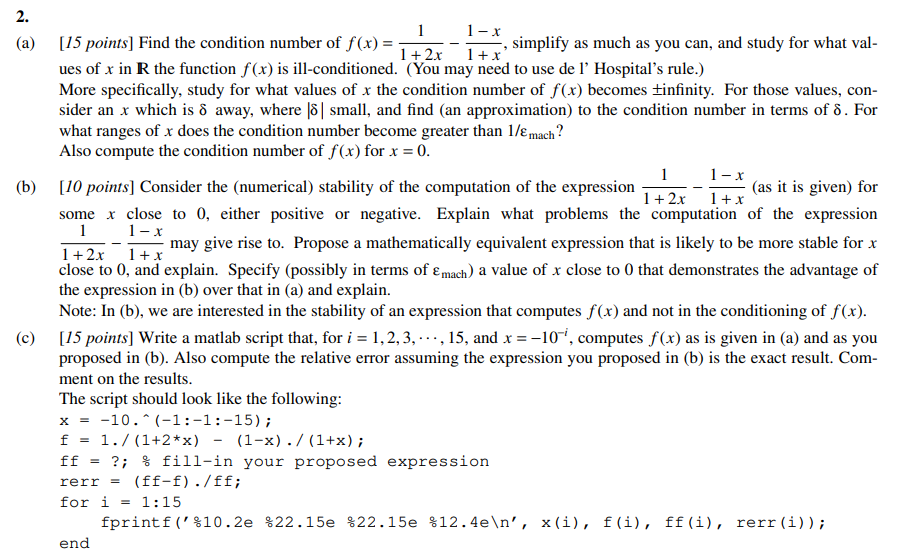
image text in transcribed

image text in transcribed

[15 points] Find the condition number of f(x)=1+2x11+x1x, simplify as much as you can, and study for what values of x in R the function f(x) is ill-conditioned. (You may need to use de l' Hospital's rule.) More specifically, study for what values of x the condition number of f(x) becomes infinity. For those values, consider an x which is away, where small, and find (an approximation) to the condition number in terms of . For what ranges of x does the condition number become greater than 1/mach ? Also compute the condition number of f(x) for x=0. [10 points] Consider the (numerical) stability of the computation of the expression 1+2x11+x1x (as it is given) for some x close to 0 , either positive or negative. Explain what problems the computation of the expression 1+2x11+x1x may give rise to. Propose a mathematically equivalent expression that is likely to be more stable for x close to 0 , and explain. Specify (possibly in terms of mach ) a value of x close to 0 that demonstrates the advantage of the expression in (b) over that in (a) and explain. Note: In (b), we are interested in the stability of an expression that computes f(x) and not in the conditioning of f(x). [15 points] Write a matlab script that, for i=1,2,3,,15, and x=10i, computes f(x) as is given in (a) and as you proposed in (b). Also compute the relative error assuming the expression you proposed in (b) is the exact result. Comment on the results. The script should look like the following: Do not alter the output format. Plot in log-log scale, the first 8 values of f versus the first 8 values of x and (the whole) ff versus x, in one plot (two lines on plot). Add labels and a legend. Plot in log-log scale, abs (rerr) versus x. Add labels. Place the two plots side-by-side in your document. Add a caption under the plots (either for the two plots together, or for each individual plot)

Step by Step Solution

There are 3 Steps involved in it

Step: 1

blur-text-image

Get Instant Access to Expert-Tailored Solutions

See step-by-step solutions with expert insights and AI powered tools for academic success

Step: 2

blur-text-image

Step: 3

blur-text-image

Ace Your Homework with AI

Get the answers you need in no time with our AI-driven, step-by-step assistance

Get Started

Recommended Textbook for

Professional SQL Server 2012 Internals And Troubleshooting

Authors: Christian Bolton, Justin Langford

1st Edition

1118177657, 9781118177655

More Books

Students also viewed these Databases questions