Answered step by step
Verified Expert Solution
Question
1 Approved Answer
7. 150 people were surveyed about their favorite ice cream flavors (mock data): 82 liked chocolate 66 like strawberry 77 like vanilla 10 like

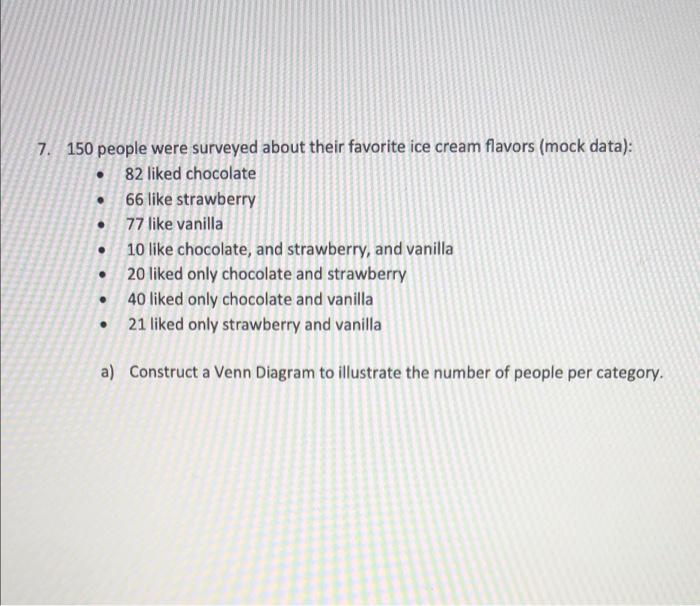
7. 150 people were surveyed about their favorite ice cream flavors (mock data): 82 liked chocolate 66 like strawberry 77 like vanilla 10 like chocolate, and strawberry, and vanilla 20 liked only chocolate and strawberry 40 liked only chocolate and vanilla 21 liked only strawberry and vanilla a) Construct a Venn Diagram to illustrate the number of people per category.
Step by Step Solution
There are 3 Steps involved in it
Step: 1
To solve this problem well use the principle of inclusionexclusion which helps in calculating the un...
Get Instant Access to Expert-Tailored Solutions
See step-by-step solutions with expert insights and AI powered tools for academic success
Step: 2

Step: 3

Ace Your Homework with AI
Get the answers you need in no time with our AI-driven, step-by-step assistance
Get Started


