Answered step by step
Verified Expert Solution
Link Copied!

Question

1 Approved Answer

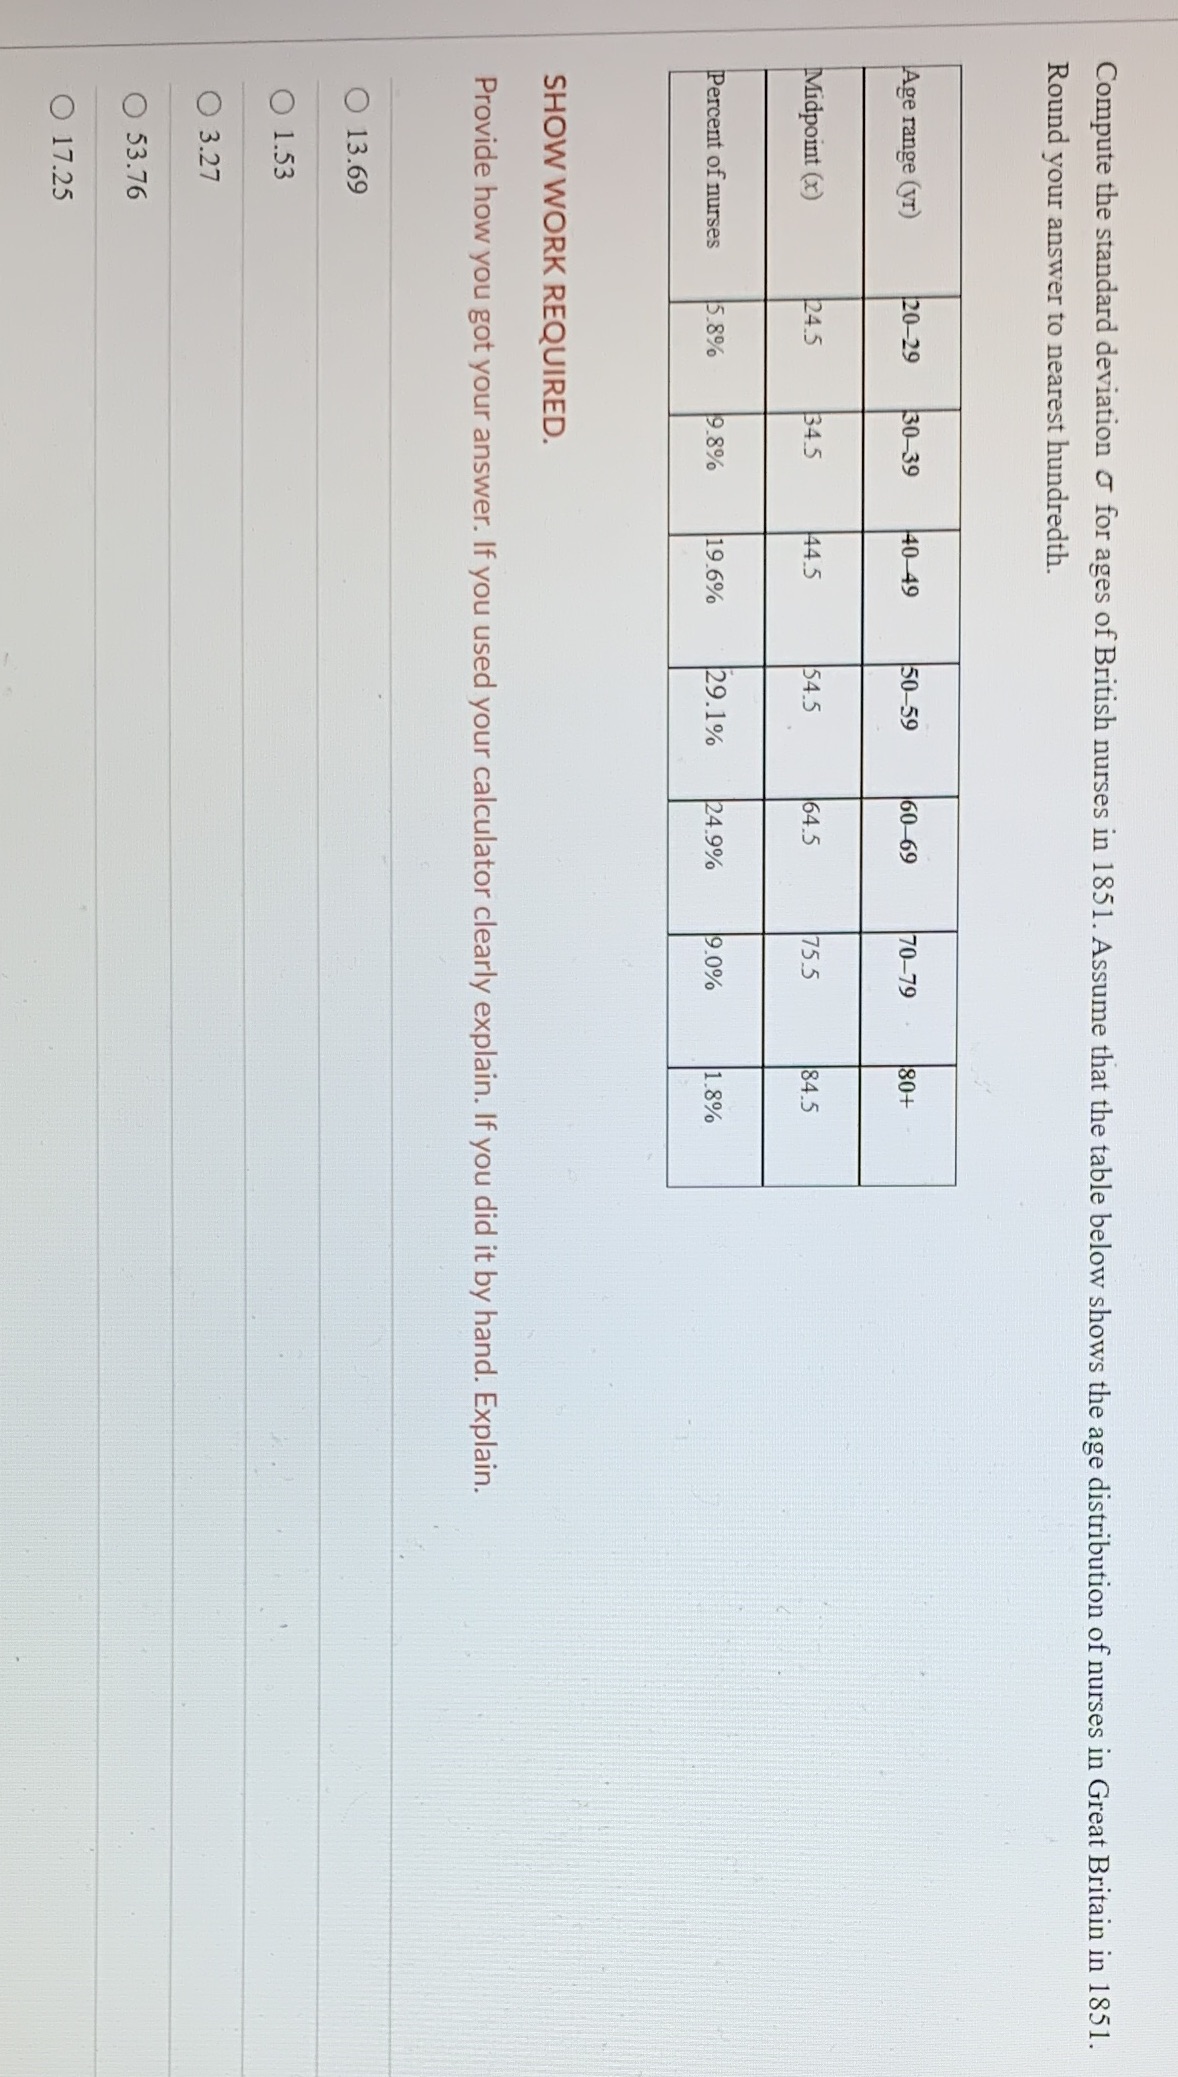
16. Compute the standard deviation & for ages of British nurses in 1851. Assume that the table below shows the age distribution of nurses in

16.

image text in transcribed
Compute the standard deviation & for ages of British nurses in 1851. Assume that the table below shows the age distribution of nurses in Great Britain in 1851. Round your answer to nearest hundredth. Age range (yr) 20-29 30-39 40-49 50-59 60-69 70-79 180+ Midpoint (x) 24.5 34.5 44.5 54.5 64.5 75.5 84.5 Percent of nurses 5.8% 9 8% 19.6% 29.1% 24.9% 9.0% 1.8% SHOW WORK REQUIRED. Provide how you got your answer. If you used your calculator clearly explain. If you did it by hand. Explain. O 13.69 O 1.53 O 3.27 0 53.76 O 17.25

Step by Step Solution

There are 3 Steps involved in it

Step: 1

blur-text-image

Get Instant Access to Expert-Tailored Solutions

See step-by-step solutions with expert insights and AI powered tools for academic success

Step: 2

blur-text-image

Step: 3

blur-text-image

Ace Your Homework with AI

Get the answers you need in no time with our AI-driven, step-by-step assistance

Get Started

Recommended Textbook for

Applied Calculus

Authors: Stefan Waner, Steven Costenoble

7th Edition

1337514306, 9781337514309

More Books

Students also viewed these Mathematics questions