Answered step by step
Verified Expert Solution
Link Copied!

Question

1 Approved Answer

1.6/ Linear Regression: Use Excel to determine the slope, m, and the y-intercept, b, of the distance speed following data. The distance, d, is the
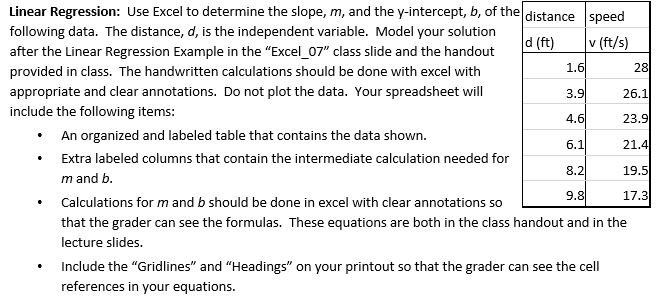
image text in transcribed

1.6/ Linear Regression: Use Excel to determine the slope, m, and the y-intercept, b, of the distance speed following data. The distance, d, is the independent variable. Model your solution d (ft) v(ft/s) after the Linear Regression Example in the "Excel_07" class slide and the handout provided in class. The handwritten calculations should be done with excel with appropriate and clear annotations. Do not plot the data. Your spreadsheet will 26.1 include the following items: 23.9 An organized and labeled table that contains the data shown. Extra labeled columns that contain the intermediate calculation needed for m and b. Calculations for m and b should be done in excel with clear annotations so that the grader can see the formulas. These equations are both in the class handout and in the lecture slides. Include the "Gridlines" and "Headings" on your printout so that the grader can see the cell references in your equations. 21.4 19.5 9.8 17.3 1.6/ Linear Regression: Use Excel to determine the slope, m, and the y-intercept, b, of the distance speed following data. The distance, d, is the independent variable. Model your solution d (ft) v(ft/s) after the Linear Regression Example in the "Excel_07" class slide and the handout provided in class. The handwritten calculations should be done with excel with appropriate and clear annotations. Do not plot the data. Your spreadsheet will 26.1 include the following items: 23.9 An organized and labeled table that contains the data shown. Extra labeled columns that contain the intermediate calculation needed for m and b. Calculations for m and b should be done in excel with clear annotations so that the grader can see the formulas. These equations are both in the class handout and in the lecture slides. Include the "Gridlines" and "Headings" on your printout so that the grader can see the cell references in your equations. 21.4 19.5 9.8 17.3

Step by Step Solution

There are 3 Steps involved in it

Step: 1

blur-text-image

Get Instant Access to Expert-Tailored Solutions

See step-by-step solutions with expert insights and AI powered tools for academic success

Step: 2

blur-text-image_2

Step: 3

blur-text-image_3

Ace Your Homework with AI

Get the answers you need in no time with our AI-driven, step-by-step assistance

Get Started

Recommended Textbook for

Select Healthcare Classification Systems And Databases

Authors: Katherine S. Rowell, Ann Cutrell

1st Edition

0615909760, 978-0615909769

More Books

Students also viewed these Databases questions

Question

In bargaining, does it really matter who makes the first offer?

Answered: 1 week ago

Question

Azure Analytics is a suite made up of which three tools?

Answered: 1 week ago

Question

7. Discuss the advantages of embedded learning.

Answered: 1 week ago