

Answered step by step
Verified Expert Solution
Question
1 Approved Answer
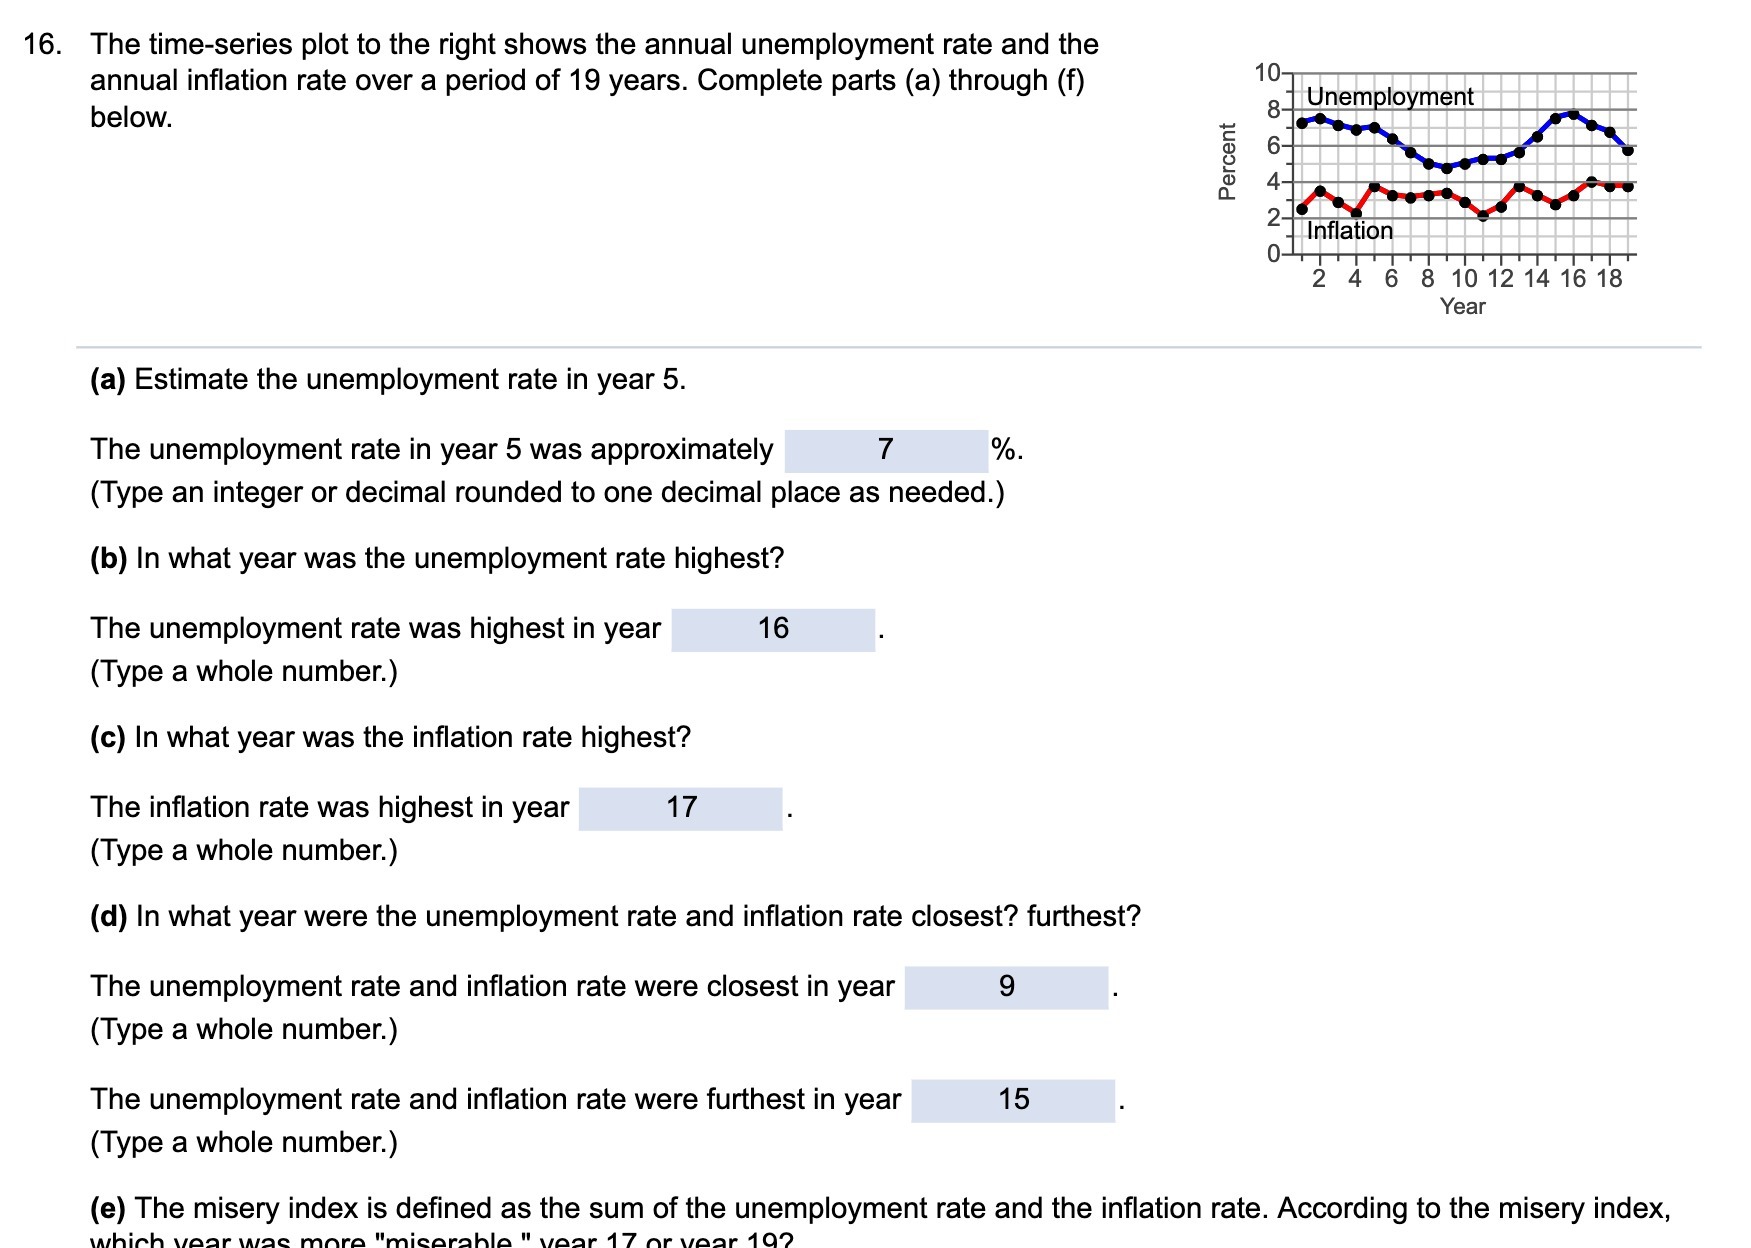
16. The time-series plot to the right shows the annual unemployment rate and the annual inflation rate over a period of 19 years. Complete parts
Step by Step Solution
There are 3 Steps involved in it
Step: 1

Get Instant Access to Expert-Tailored Solutions
See step-by-step solutions with expert insights and AI powered tools for academic success
Step: 2

Step: 3
Ace Your Homework with AI
Get the answers you need in no time with our AI-driven, step-by-step assistance
Get Started
Intermediate Accounting
Authors: Donald E. Kieso, Jerry J. Weygandt, And Terry D. Warfield
13th Edition
9780470374948, 470423684, 470374942, 978-0470423684