

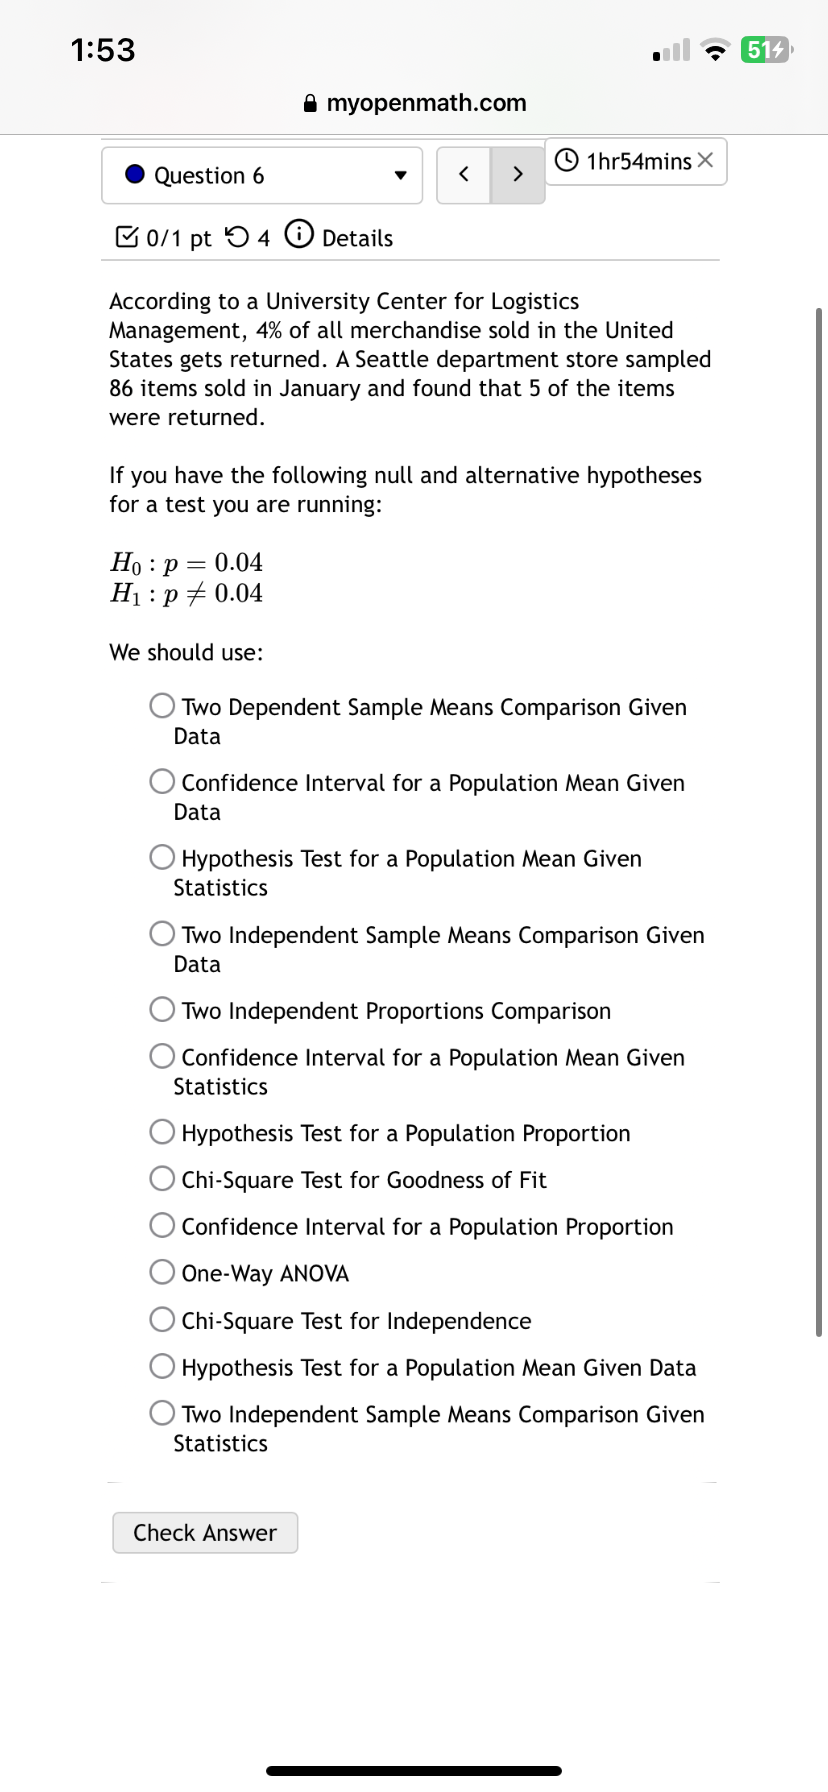
Question: 1:62 Done & myopenmath.com o ) ~ 1hr54mins X Crying Time of Infants Given Shots Using Mev e cioas o || =k 61 | 62


![test statistics. Round to two decimal places. H1 =] | H2 =|](https://dsd5zvtm8ll6.cloudfront.net/si.experts.images/questions/2024/10/67086b2d119a4_97267086b2ce854b.jpg)
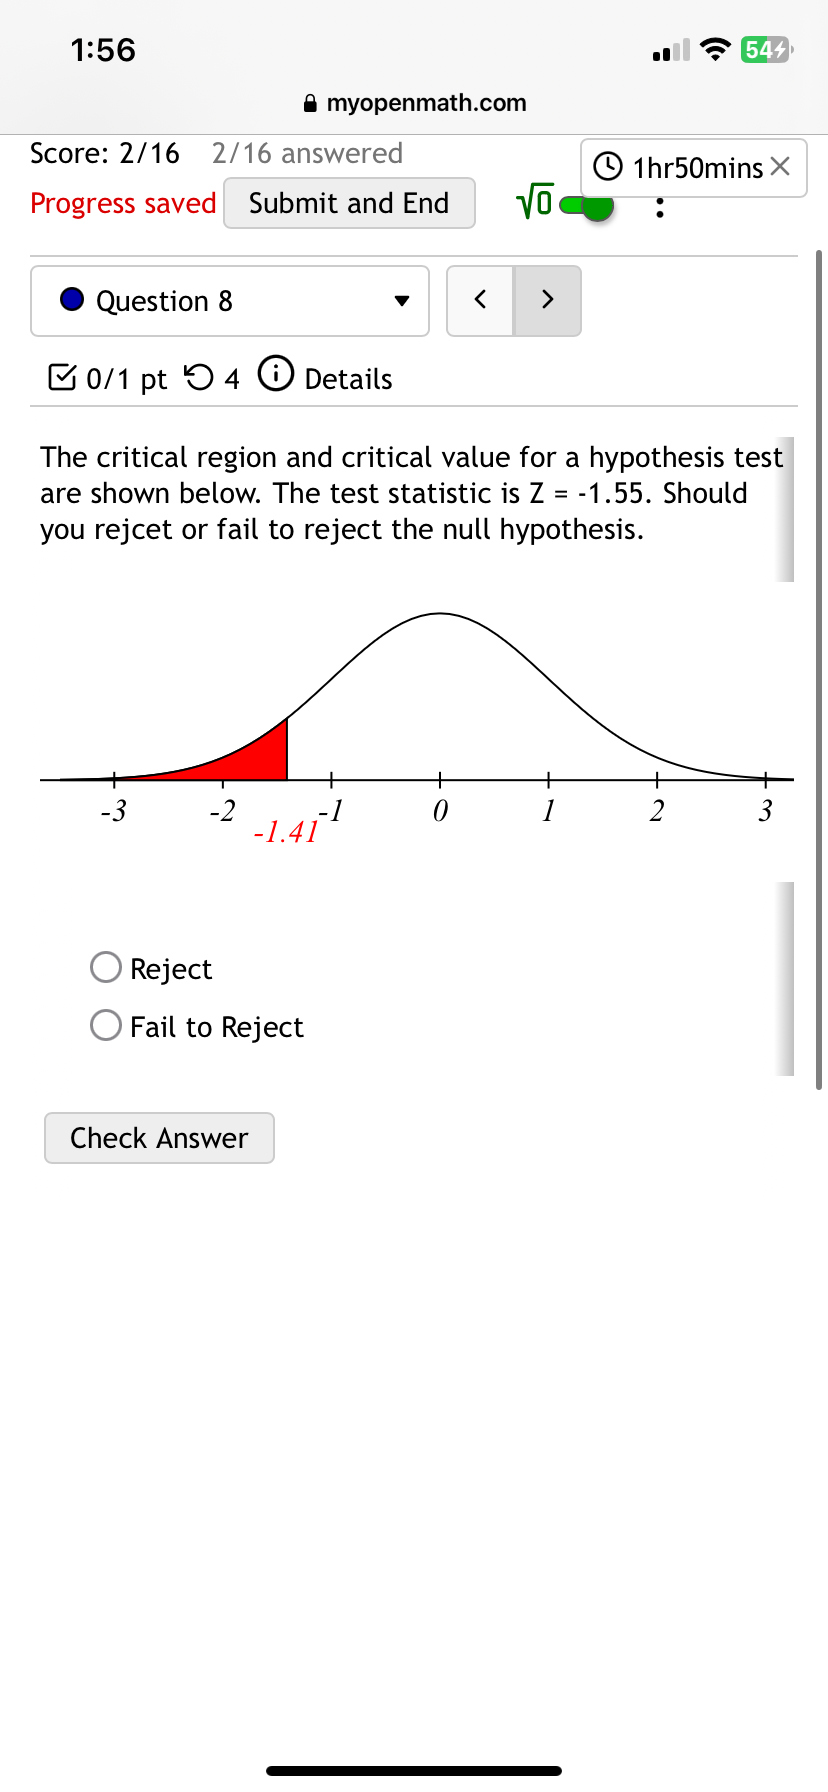

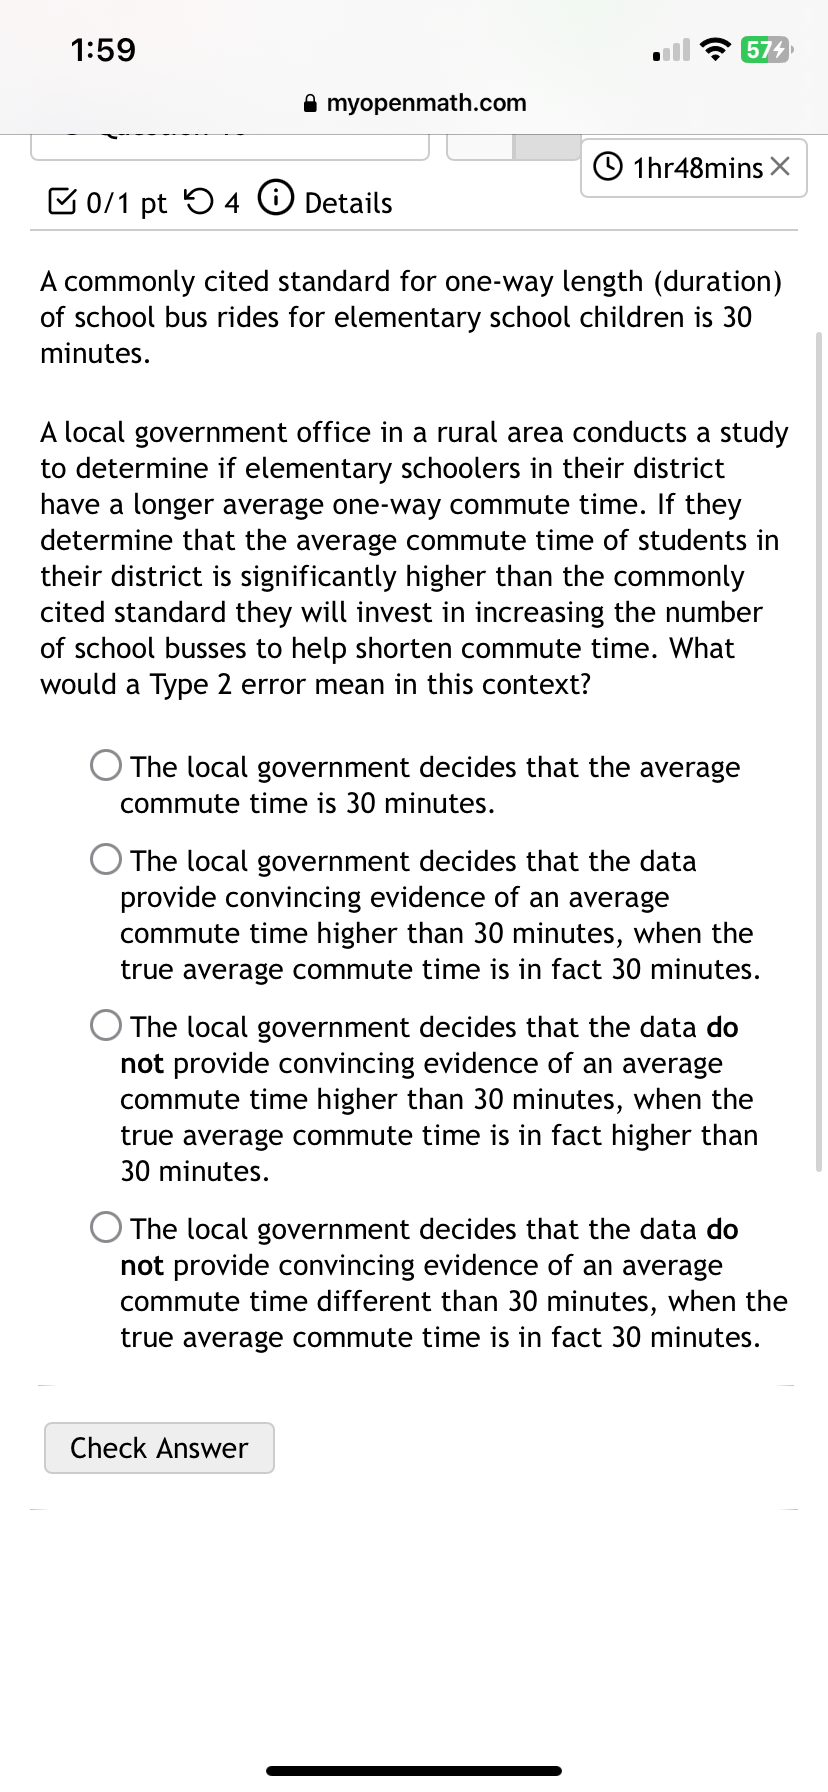
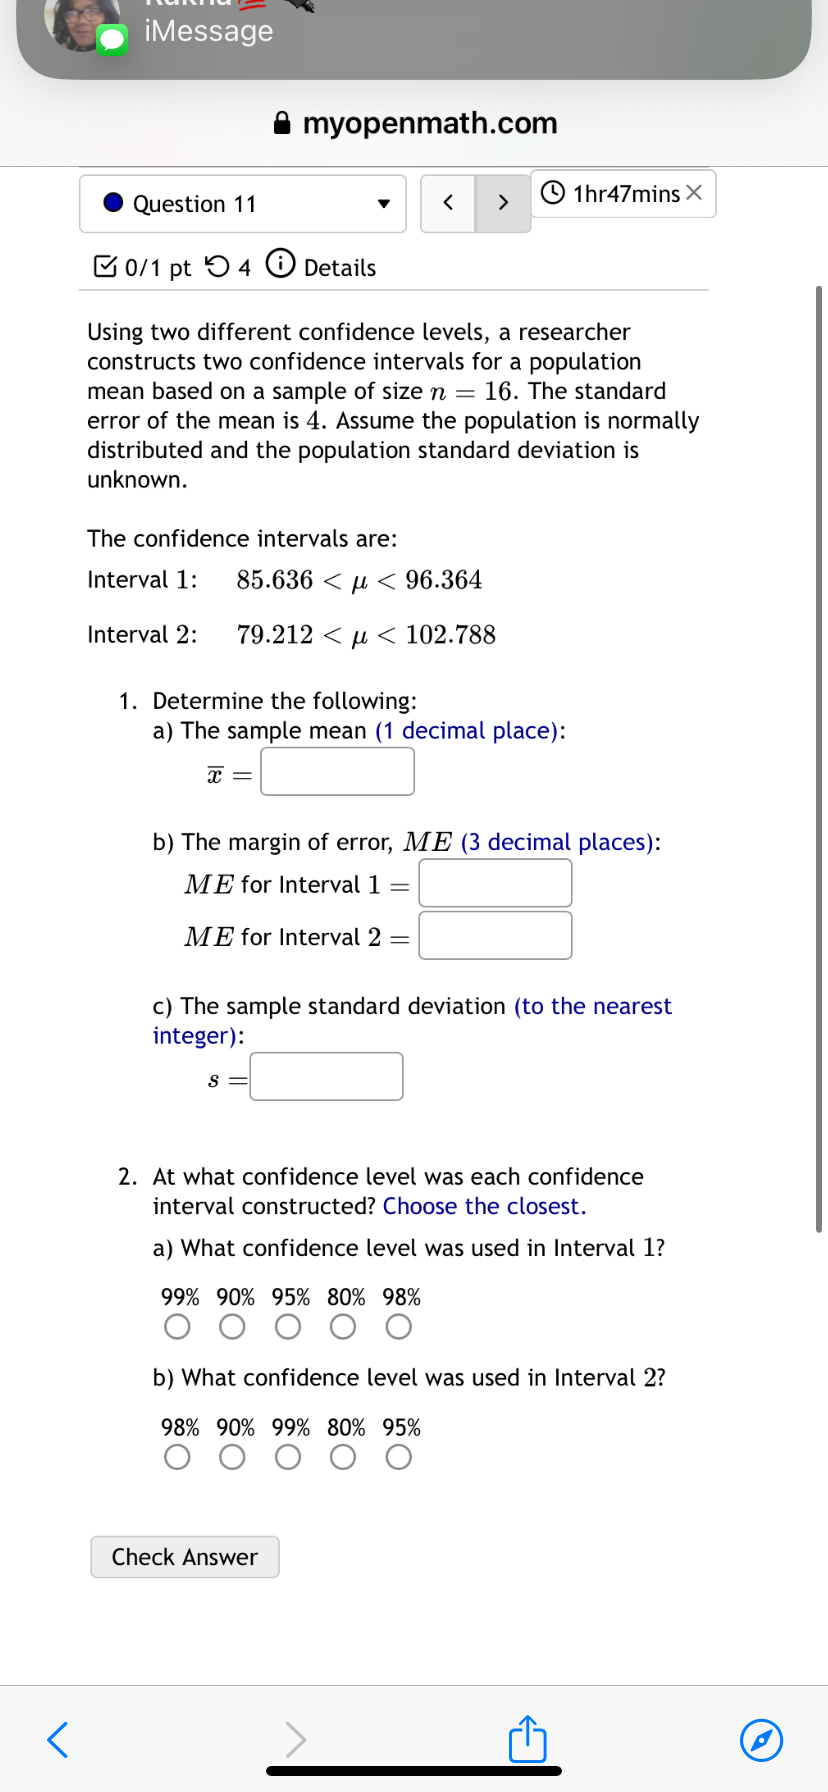
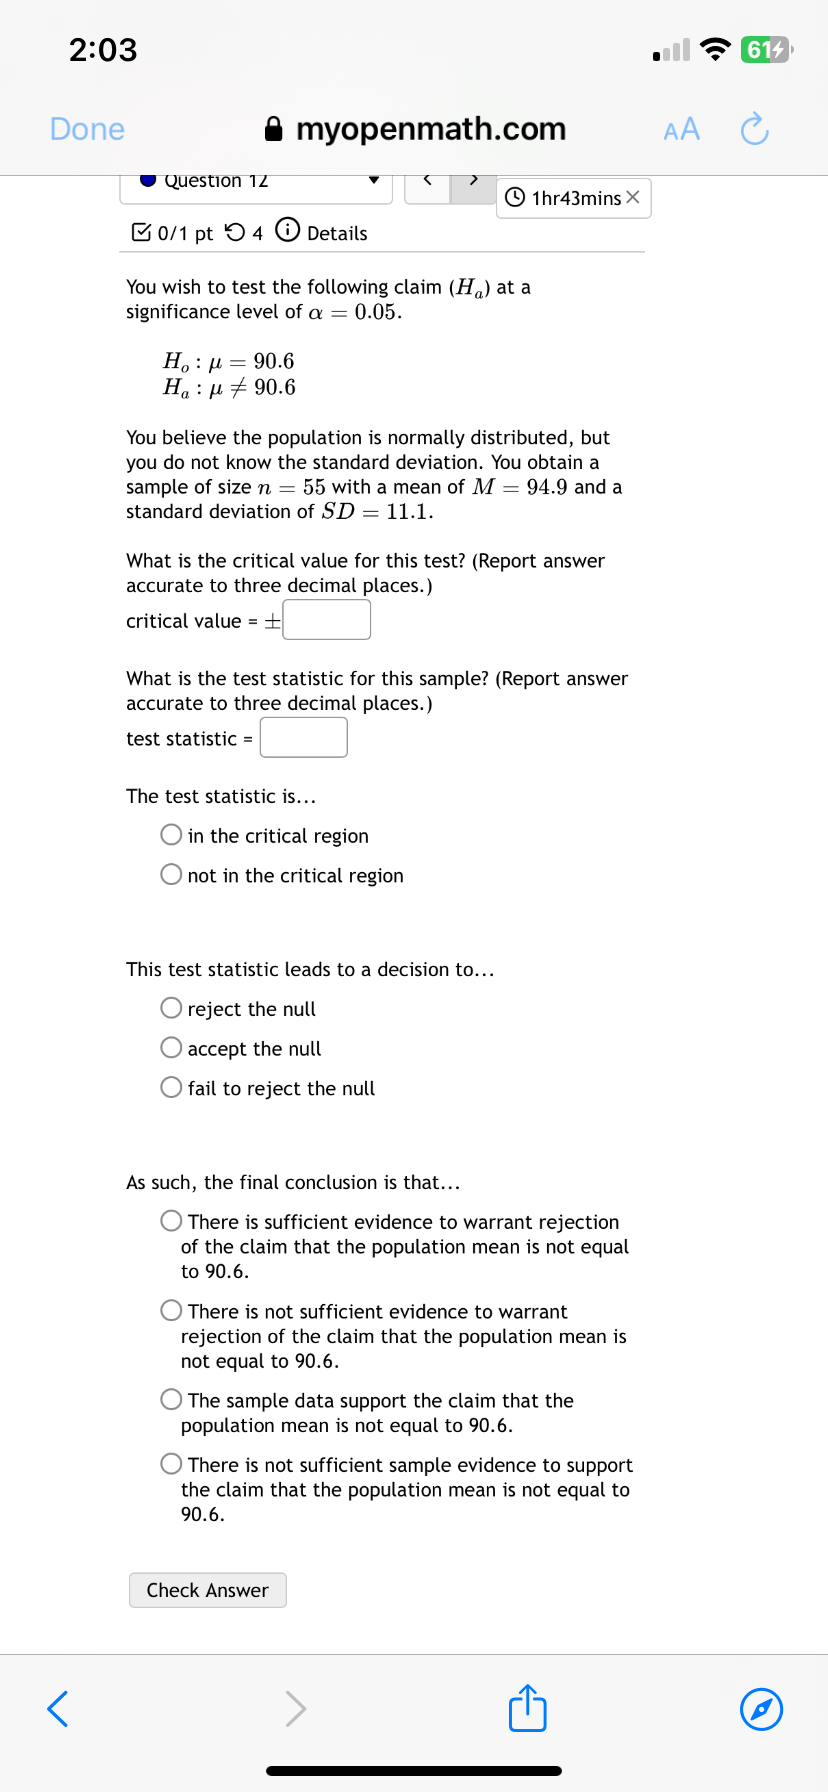
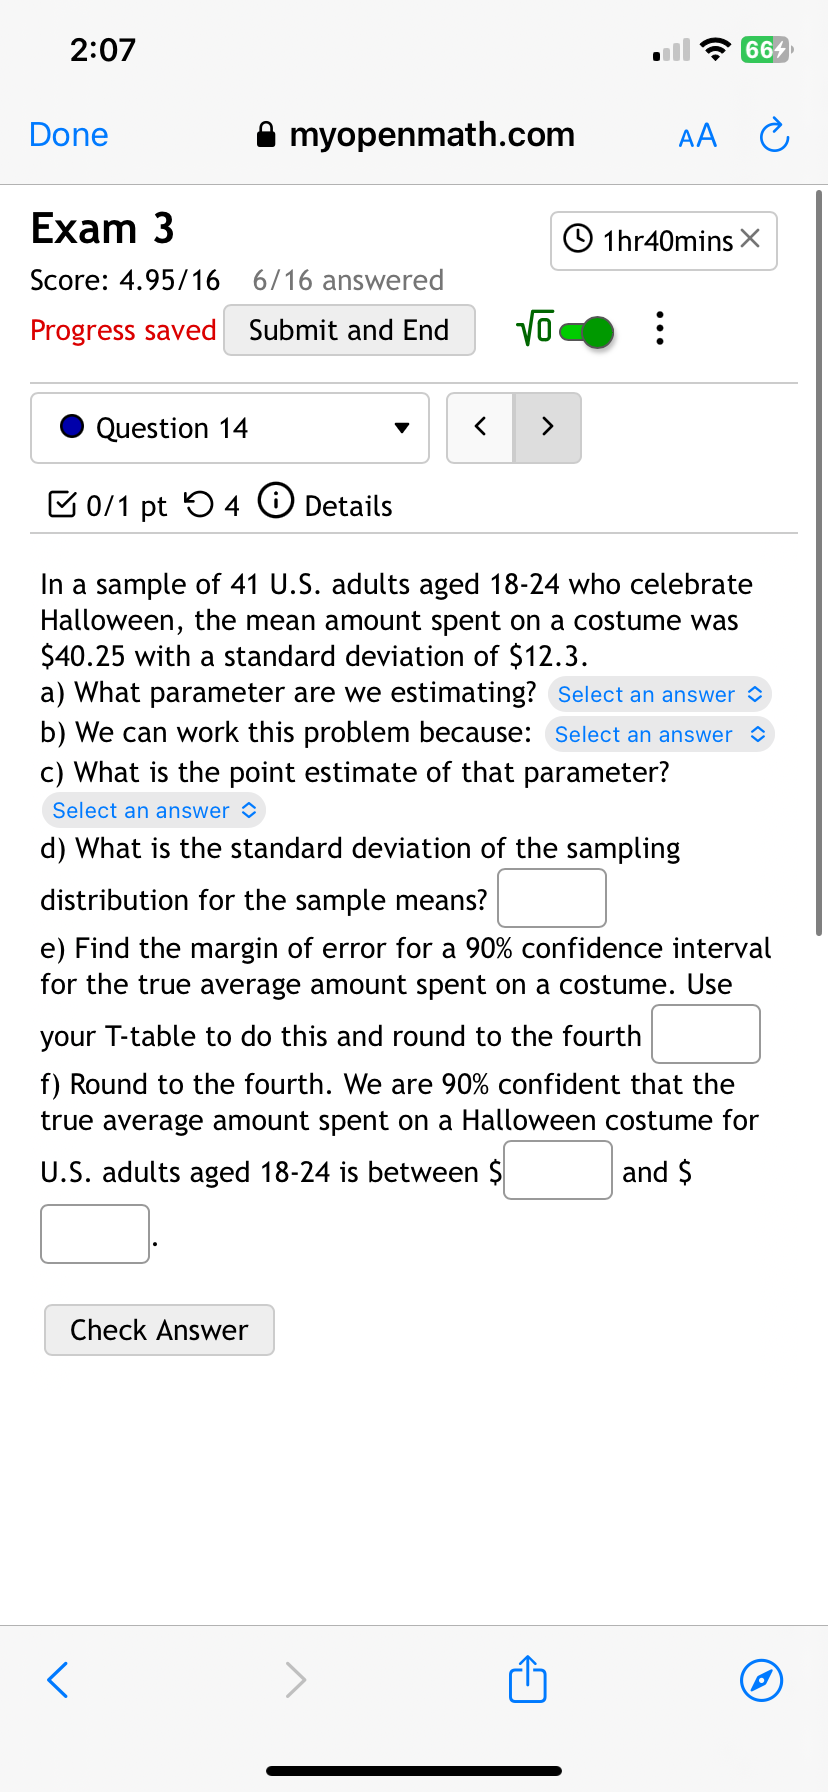
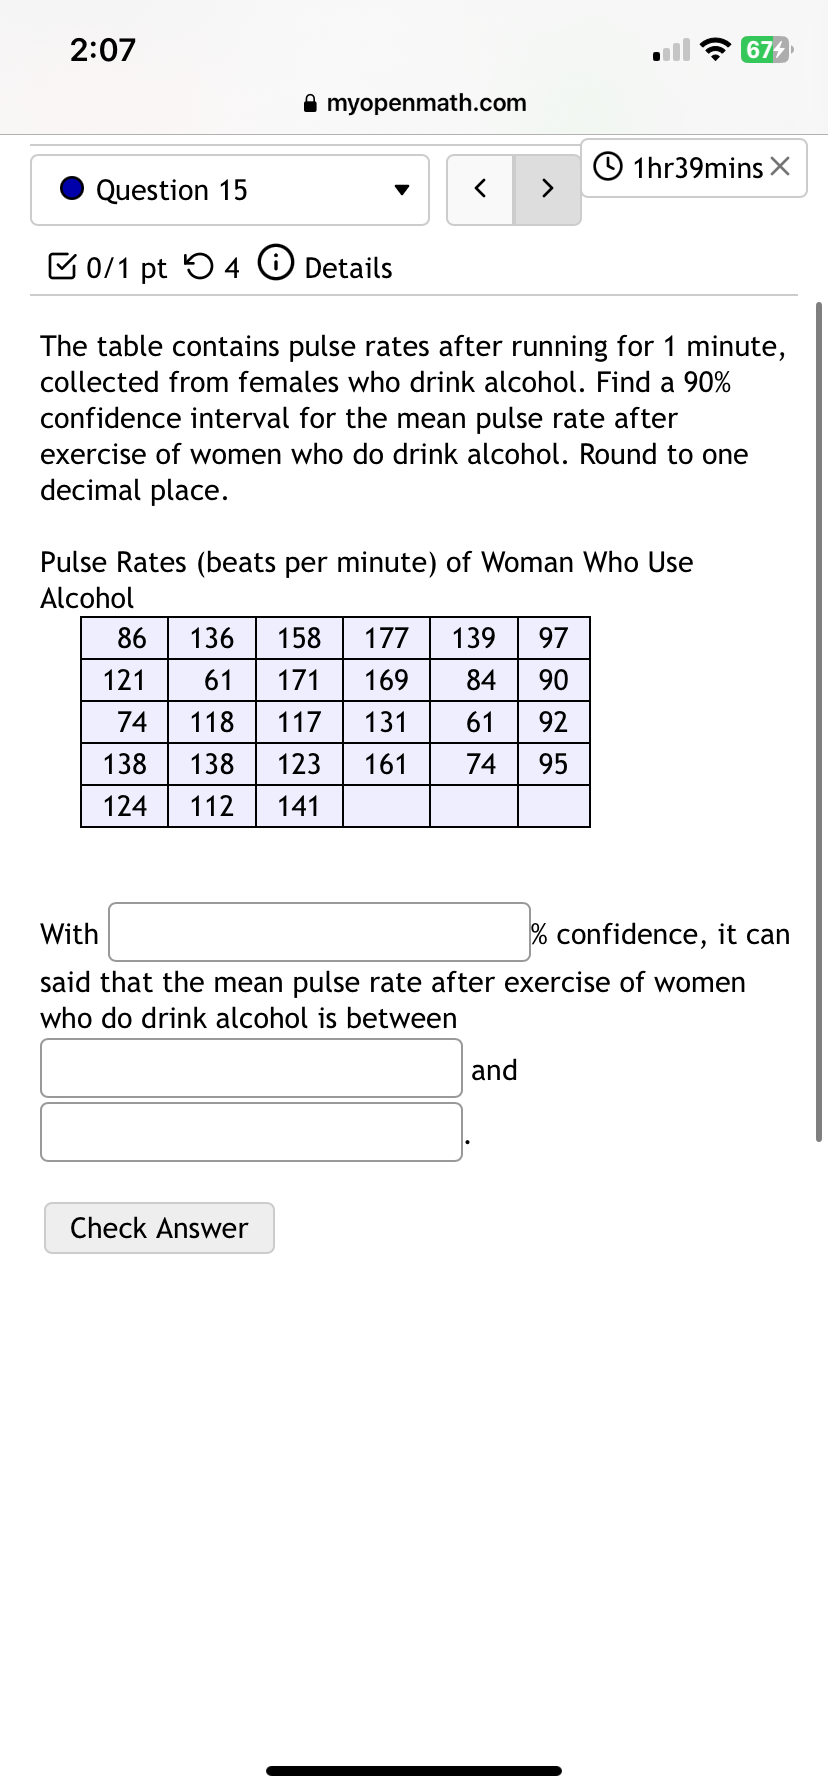
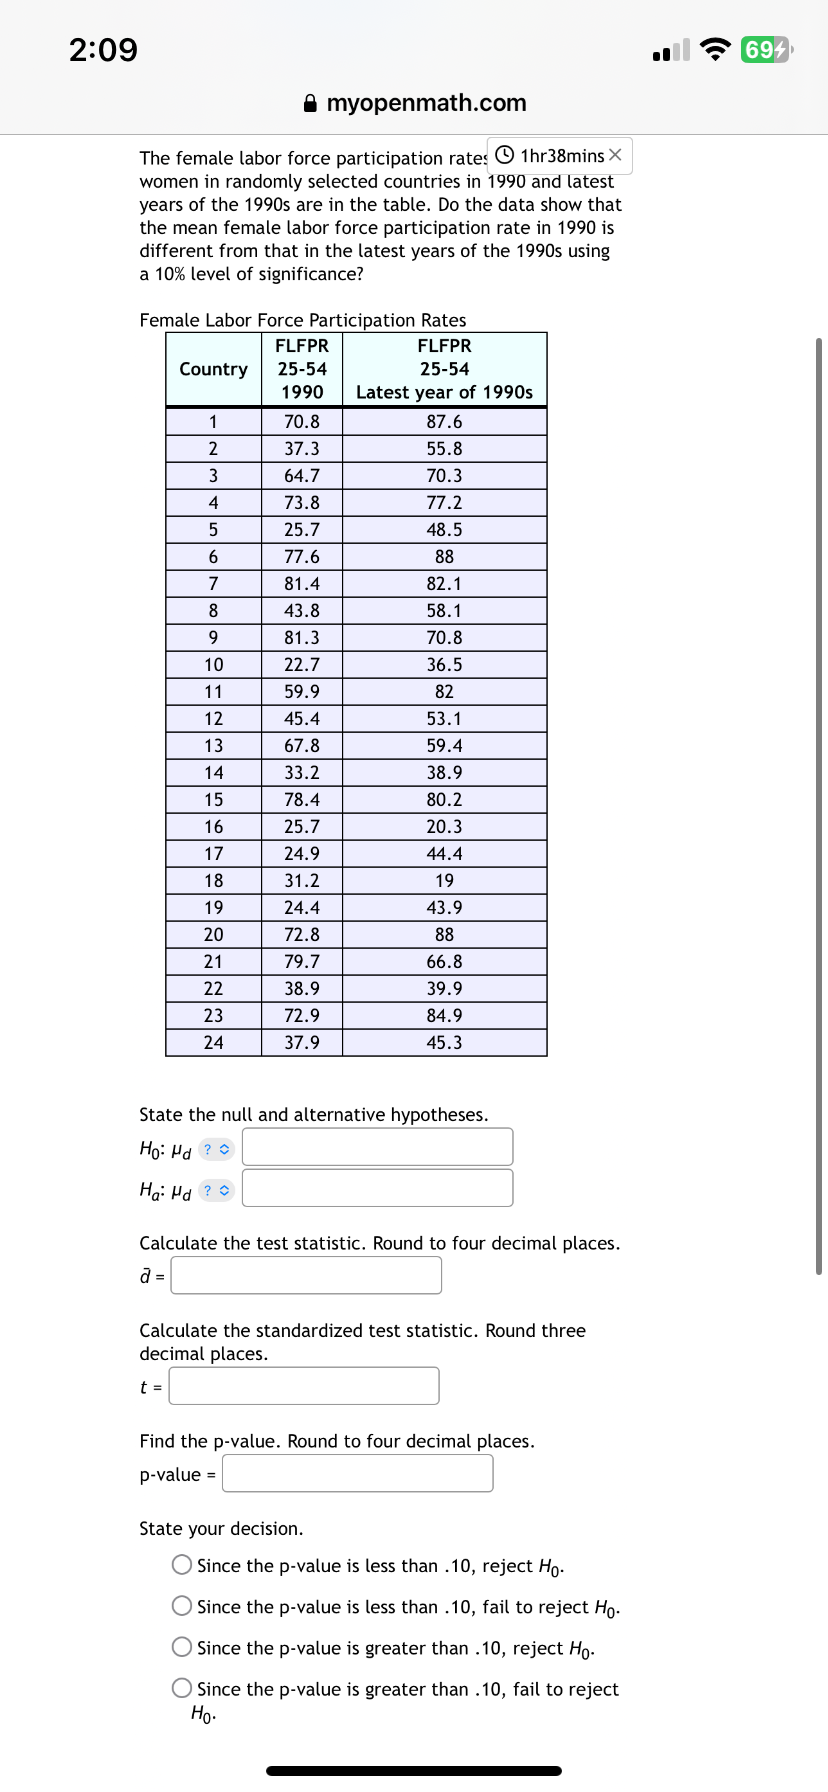
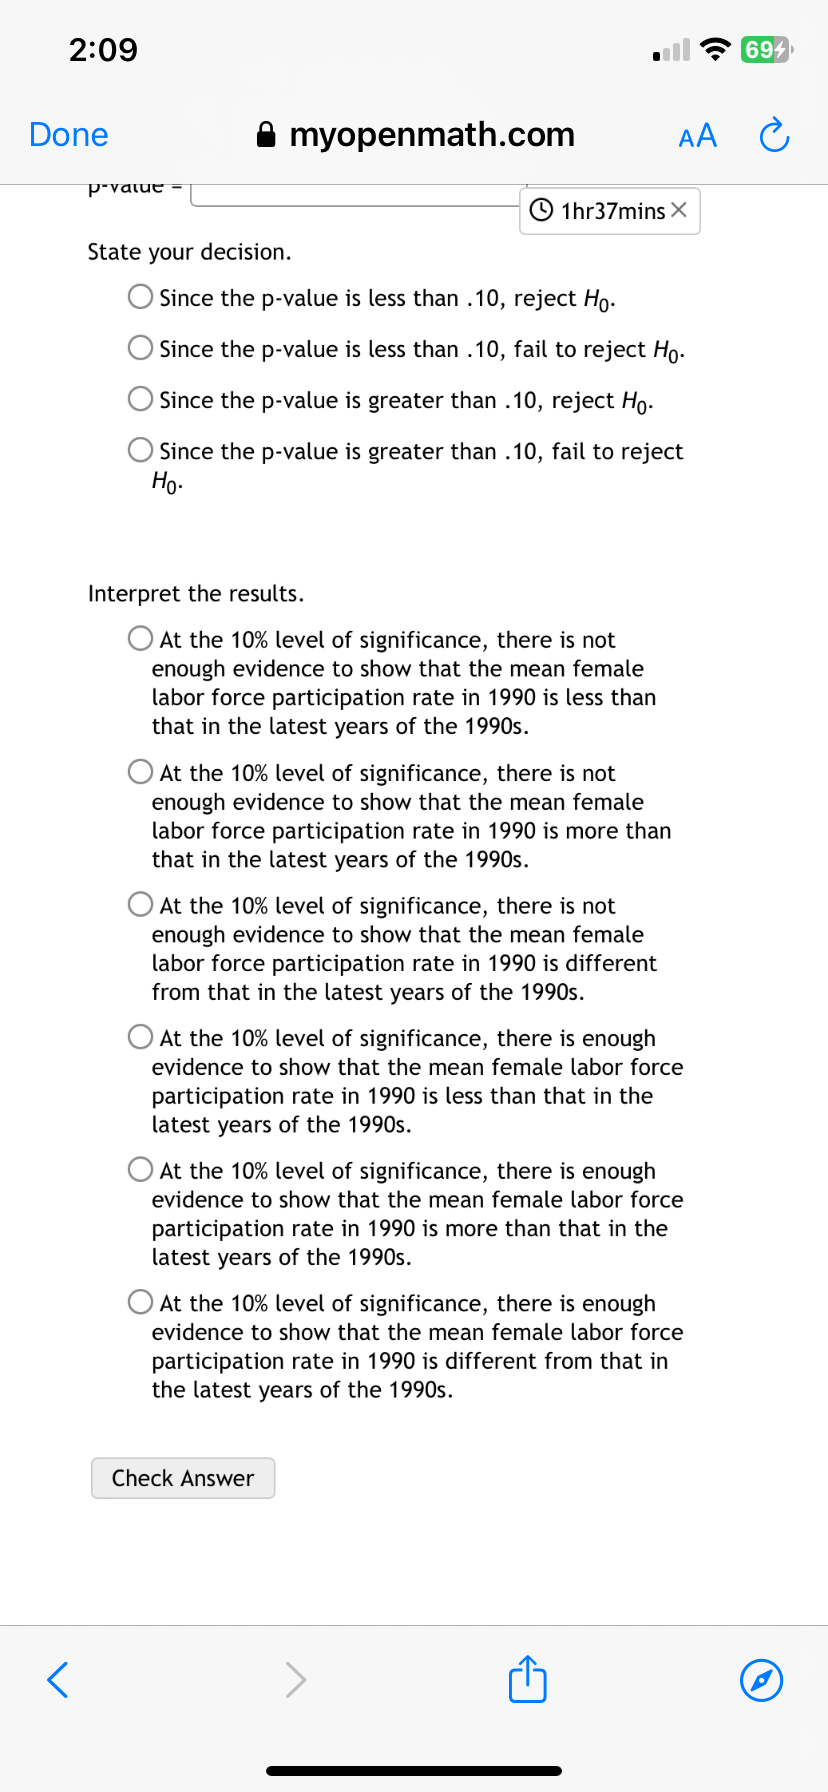
1:62 Done & myopenmath.com o ) ~ 1hr54mins X Crying Time of Infants Given Shots Using Mev e cioas o || =k 61 | 62 10 | 57 e lie 24 | 18 State the null and alternative hypotheses. Hoipy 22 1 Hotby 22 1 Calculate the test statistics. Round to two decimal places. H1 =] | H2 =| | Calculate the standardized test statistic. Round three decimal places. fi= Find the p-value. Round to four decimal places. p-value = | State your decision. ) Since the p-value is less than .10, fail to reject Hy. (O Since the p-value is greater than .10, fail to reject Ho- () Since the p-value is greater than .10, reject Hy. O Since the p-value is less than .10, reject Hg. Interpret the results. () At the 10% level of significance, there is not enough evidence to show that the infants cried more on average when they are held by their mothers than if held using conventional methods. () At the 10% level of significance, there is not enough evidence to show that the infants cried differently on average when they are held by their mothers than if held using conventional methods. () At the 10% level of significance, there is enough evidence to show that the infants cried more on average when they are held by their mothers than if held using conventional methods. C- At the 10% level of significance, there is enough evidence to show that the infants cried differently on average when they are held by their mothers than if held using conventional methods. O At the 10% level of significance, there is not enough evidence to show that the infants cried less on average when they are held by their mothers than if held using conventional methods. () At the 10% level of significance, there is enough evidence to show that the infants cried less on average when they are held by their mothers than if held using conventional methods. & 0/1pt 4 (O Details The critical region and critical value for a hypothesis test are shown below. The test statistic is Z = -1.55. Should you rejcet or fail to reject the null hypothesis. -3 -2 _1.411 0 1 2 3 O Reject O Fail to Reject Check Answer 1:57 [1] ? b & myopenmath.com Progress saved SubmitandEnd V0 @& 1hr49mins X @ Question 9 v & 0/1 pt O 4 O Details You measure 39 randomly selected textbooks' weights, and find they have a mean weight of 73 ounces. Assume the population standard deviation is 3.3 ounces. Based on this, construct a 95% confidence interval for the true population mean textbook weight. Give your answers as decimals, to two places (}'J,( Check Answer 1:59 ull & myopenmath.com == S 1hr48mins X & 0/1pt 4 O Details A commonly cited standard for one-way length (duration) of school bus rides for elementary school children is 30 minutes. A local government office in a rural area conducts a study to determine if elementary schoolers in their district have a longer average one-way commute time. If they determine that the average commute time of students in their district is significantly higher than the commonly cited standard they will invest in increasing the number of school busses to help shorten commute time. What would a Type 2 error mean in this context? (O The local government decides that the average commute time is 30 minutes. O The local government decides that the data provide convincing evidence of an average commute time higher than 30 minutes, when the true average commute time is in fact 30 minutes. () The local government decides that the data do not provide convincing evidence of an average commute time higher than 30 minutes, when the true average commute time is in fact higher than 30 minutes. () The local government decides that the data do not provide convincing evidence of an average commute time different than 30 minutes, when the true average commute time is in fact 30 minutes. Check Answer [ YRR TS & myopenmath.com @ Question 11 v 1hr47mins X & 0/1pt O 4 O Details Using two different confidence levels, a researcher constructs two confidence intervals for a population mean based on a sample of size n = 16. The standard error of the mean is 4. Assume the population is normally distributed and the population standard deviation is unknown. The confidence intervals are: Interval 1: 85.636 & 0/1pt 4 O Details In a sample of 41 U.S. adults aged 18-24 who celebrate Halloween, the mean amount spent on a costume was $40.25 with a standard deviation of $12.3. a) What parameter are we estimating? Select an answer O & 0/1pt O 4 O Details The table contains pulse rates after running for 1 minute, collected from females who drink alcohol. Find a 90% confidence interval for the mean pulse rate after exercise of women who do drink alcohol. Round to one decimal place. Pulse Rates (beats per minute) of Woman Who Use Alcohol o6 [ 136 [ 158 [ 177 [ 139 [ 97 21 | 1 [ 171 | 169 | 84|50 74 [ 118 [ 17 | 131 | et 92 KR With % confidence, it can said that the mean pulse rate after exercise of women who do drink alcohol is between and Check Answer 2:09 myopenmath.com The female labor force participation rates @ 1hr38mins X women in randomly selected countries in 1990 and latest years of the 1990s are in the table. Do the data show that the mean female labor force participation rate in 1990 is different from that in the latest years of the 1990s using a 10% level of significance? Female Labor Force Participation Rates FLFPR FLFPR Country 25-54 25-54 1990 Latest year of 1990s 1 70.8 87 .6 2 37.3 55 .8 3 54.7 70.3 4 73.8 77.2 5 25.7 48.5 6 77.6 38 7 81.4 82. 1 8 43.8 58.1 9 81.3 70.8 10 22.7 36.5 11 59.9 82 12 45.4 53.1 13 67.8 59.4 14 33.2 38.9 15 78.4 80.2 16 25.7 20.3 17 24.9 44.4 18 31.2 19 19 24.4 43.9 20 72.8 88 21 79.7 66.8 22 38.9 39.9 23 72.9 84.9 24 37.9 45.3 State the null and alternative hypotheses. Ho: Hd ? Hai Hd ? Calculate the test statistic. Round to four decimal places. d = Calculate the standardized test statistic. Round three decimal places. t = Find the p-value. Round to four decimal places. p-value = State your decision. O Since the p-value is less than . 10, reject Ho- O Since the p-value is less than .10, fail to reject Ho. O Since the p-value is greater than . 10, reject Ho- O Since the p-value is greater than . 10, fail to reject Ho.L~ = ( 2:09 . Done & myopenmath.com AA pPryvawe = | ( 1hr37mins X State your decision. (O Since the p-value is less than .10, reject H. (O Since the p-value is less than .10, fail to reject Hp. (O since the p-value is greater than .10, reject Hg. (O Since the p-value is greater than .10, fail to reject Hp. Interpret the results. (O At the 10% level of significance, there is not enough evidence to show that the mean female labor force participation rate in 1990 is less than that in the latest years of the 1990s. () At the 10% level of significance, there is not enough evidence to show that the mean female labor force participation rate in 1990 is more than that in the latest years of the 1990s. () At the 10% level of significance, there is not enough evidence to show that the mean female labor force participation rate in 1990 is different from that in the latest years of the 1990s. (O At the 10% level of significance, there is enough evidence to show that the mean female labor force participation rate in 1990 is less than that in the latest years of the 1990s. (O At the 10% level of significance, there is enough evidence to show that the mean female labor force participation rate in 1990 is more than that in the latest years of the 1990s. (O At the 10% level of significance, there is enough evidence to show that the mean female labor force participation rate in 1990 is different from that in the latest years of the 1990s. Check Answer G
Step by Step Solution
There are 3 Steps involved in it

Get step-by-step solutions from verified subject matter experts