Question: Unit 3 Practice Problems Set 16 |Also, note that the templates for hypothesis testing provided in the Excel Guides for this unit are given in
Unit 3 Practice Problems Set
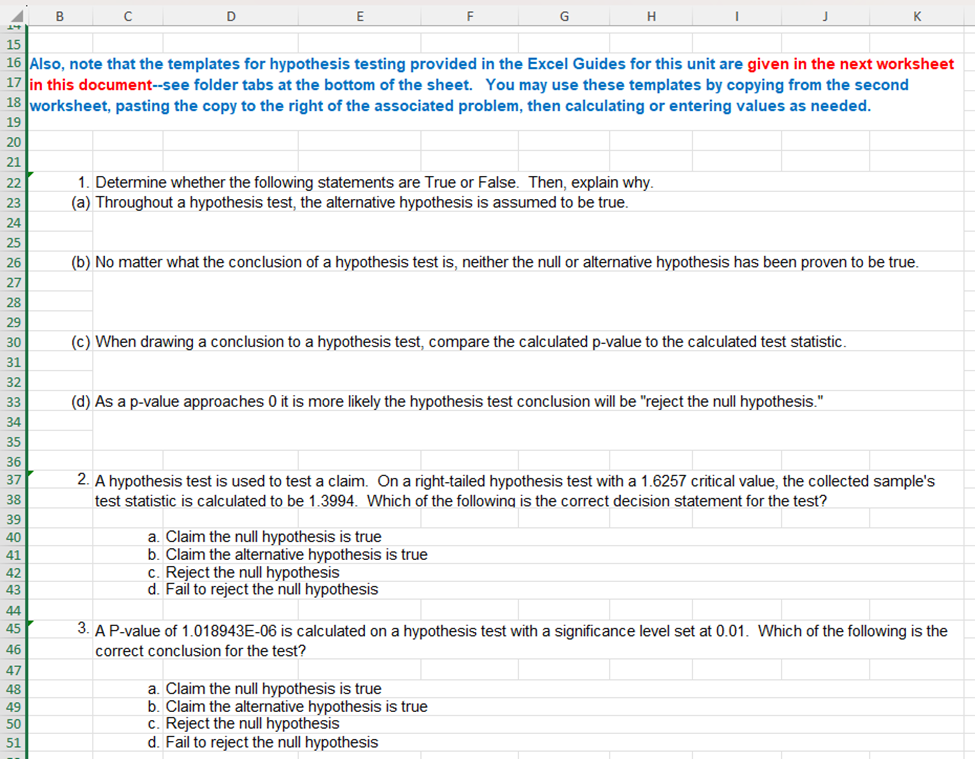
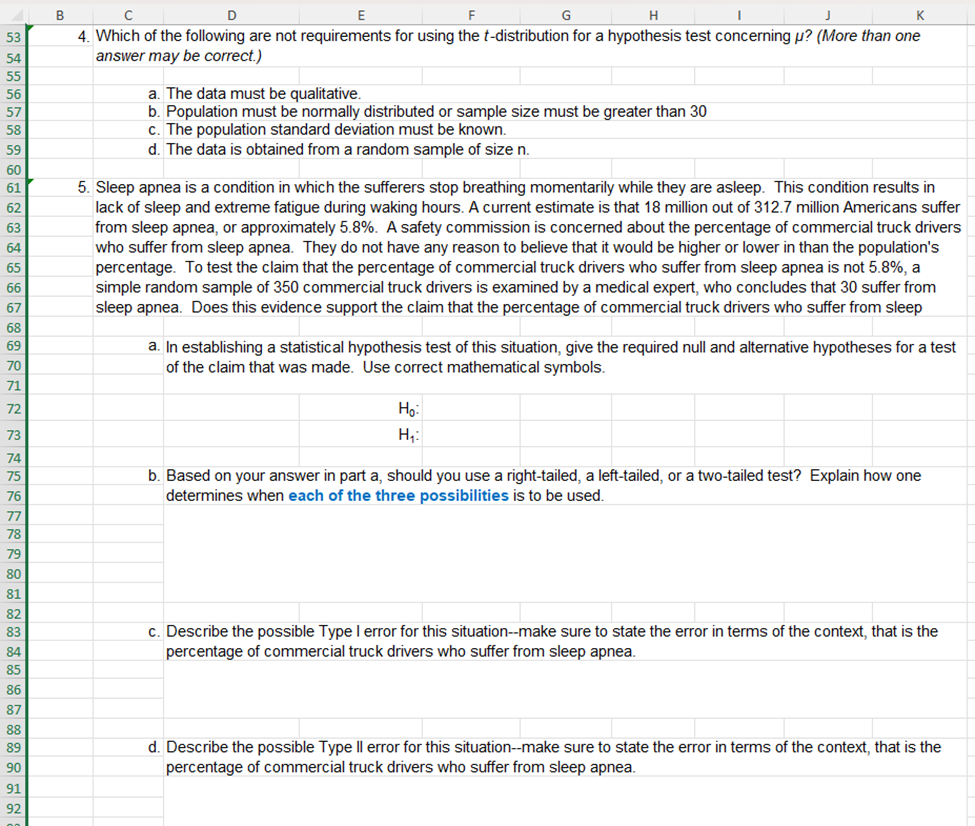
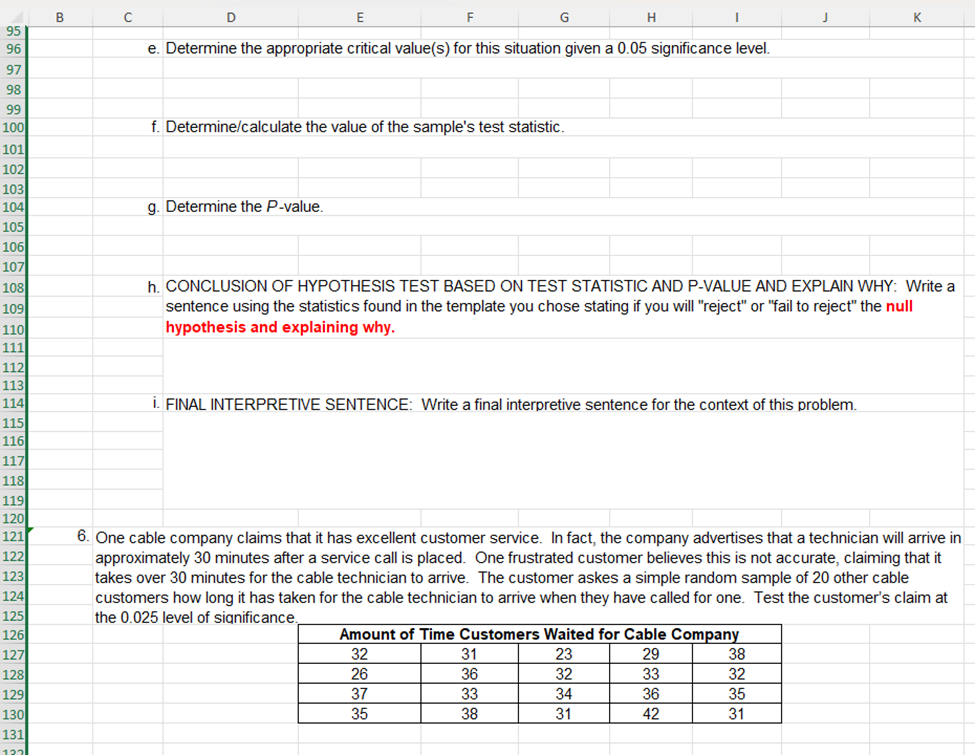
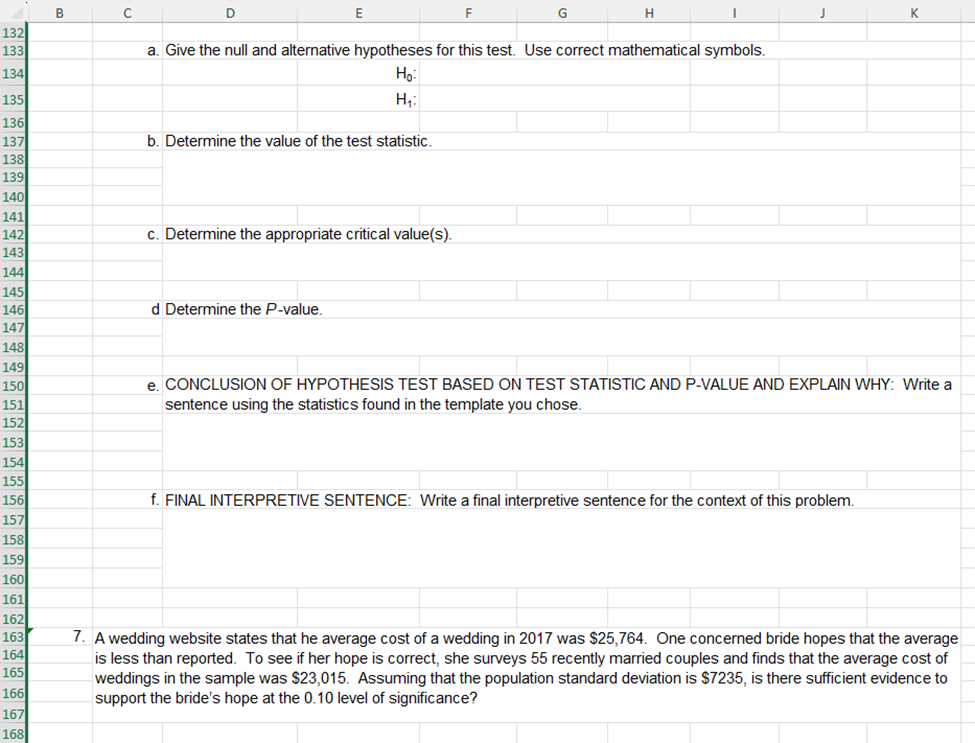
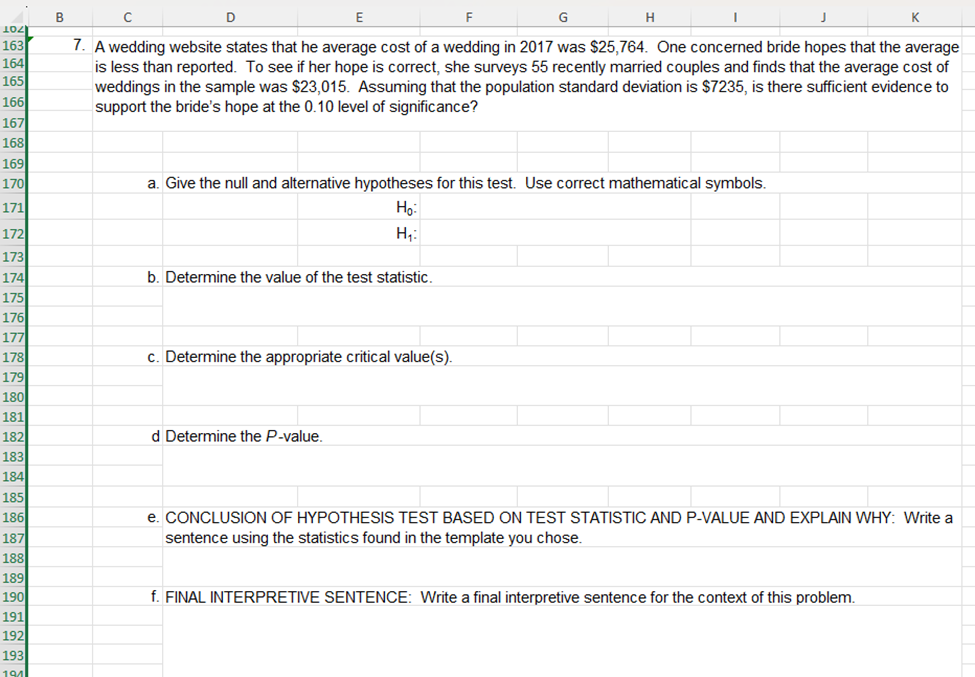
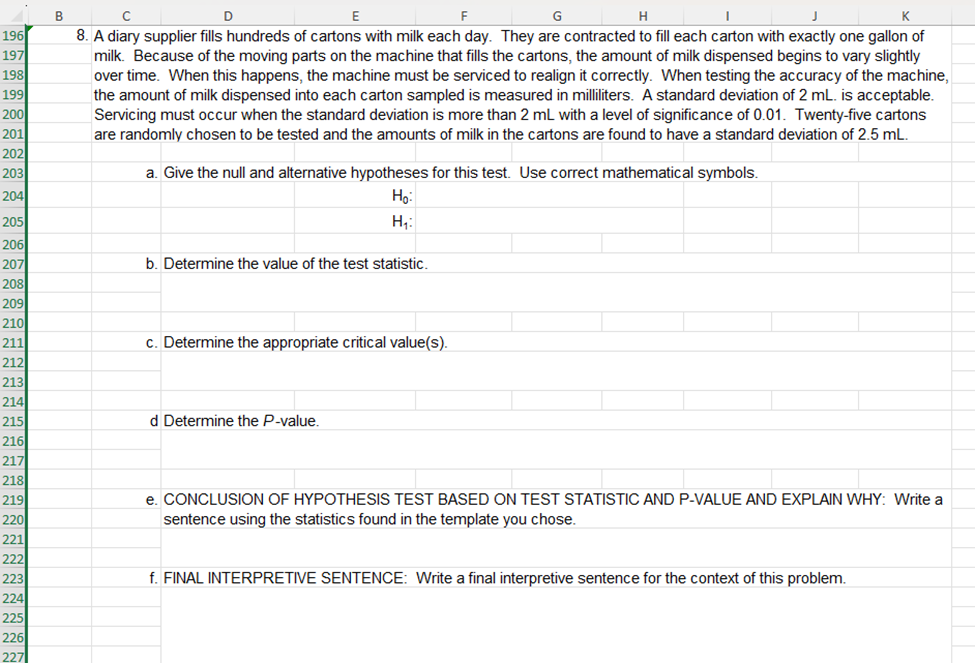
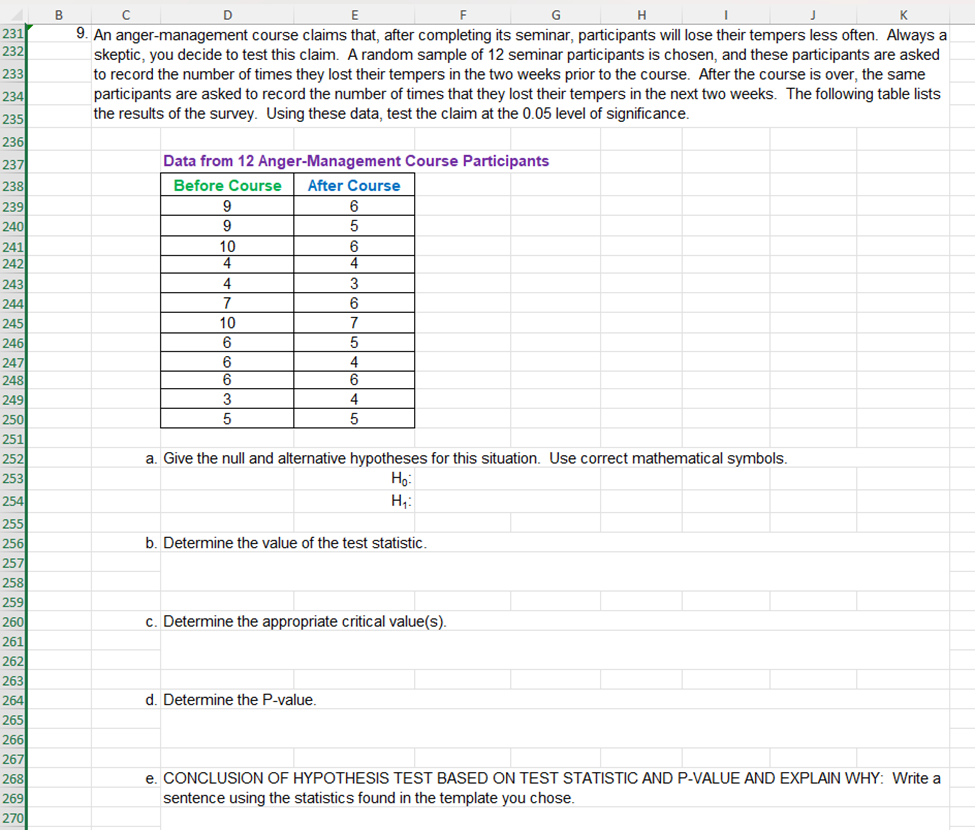
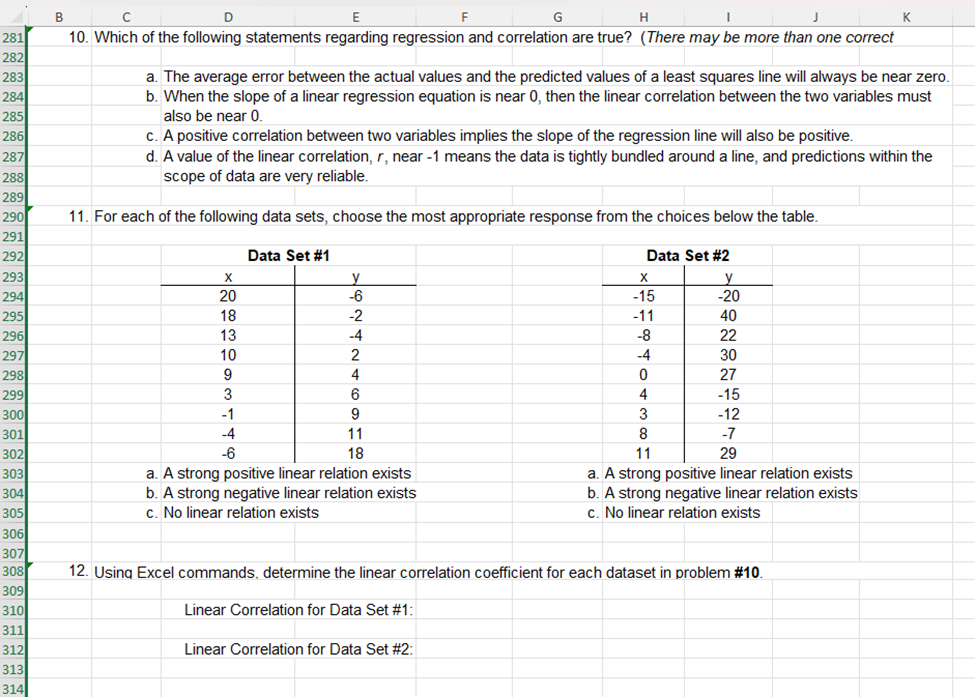
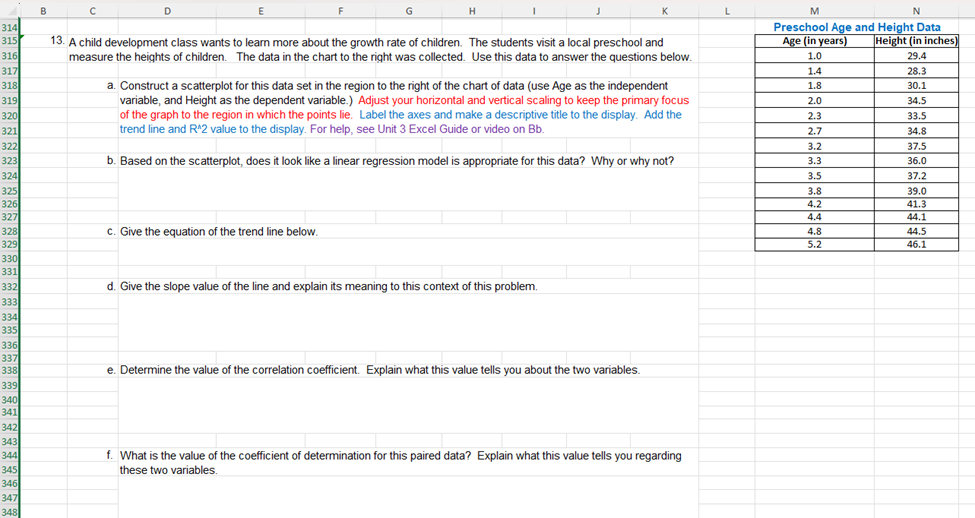
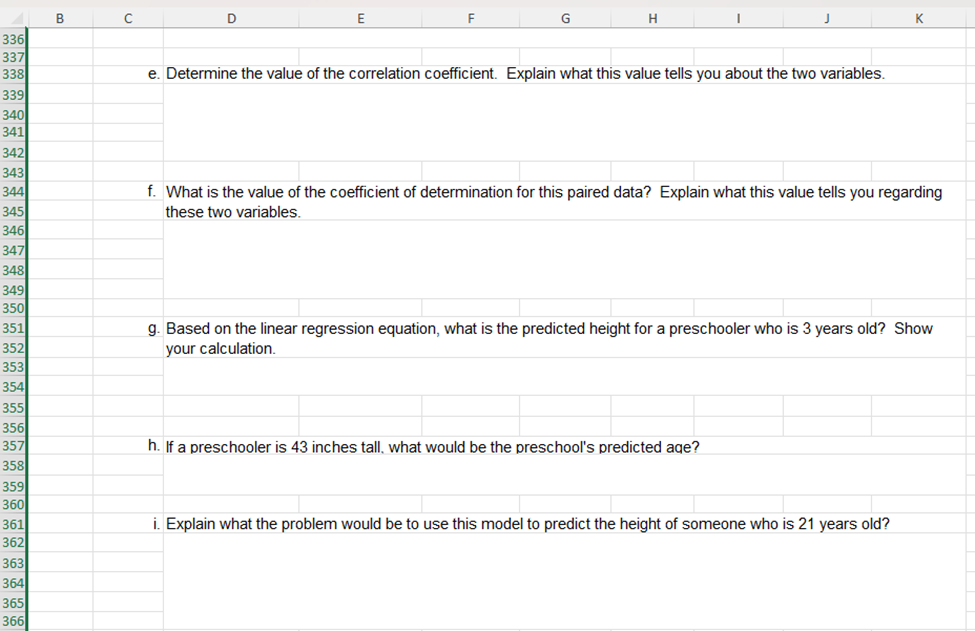
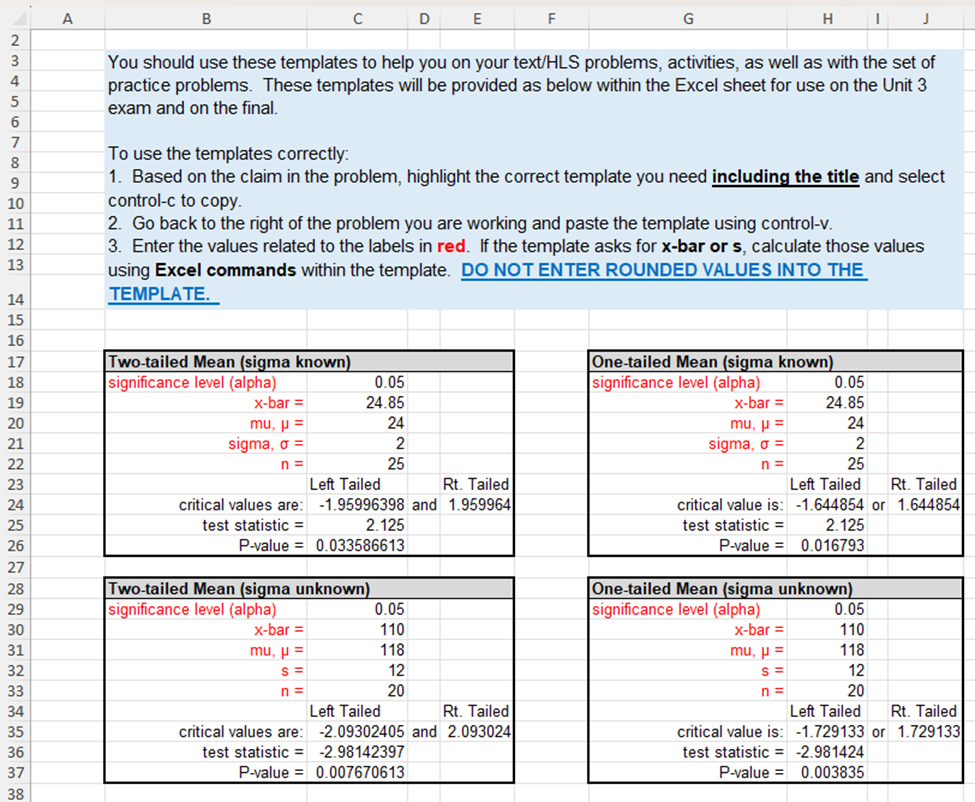
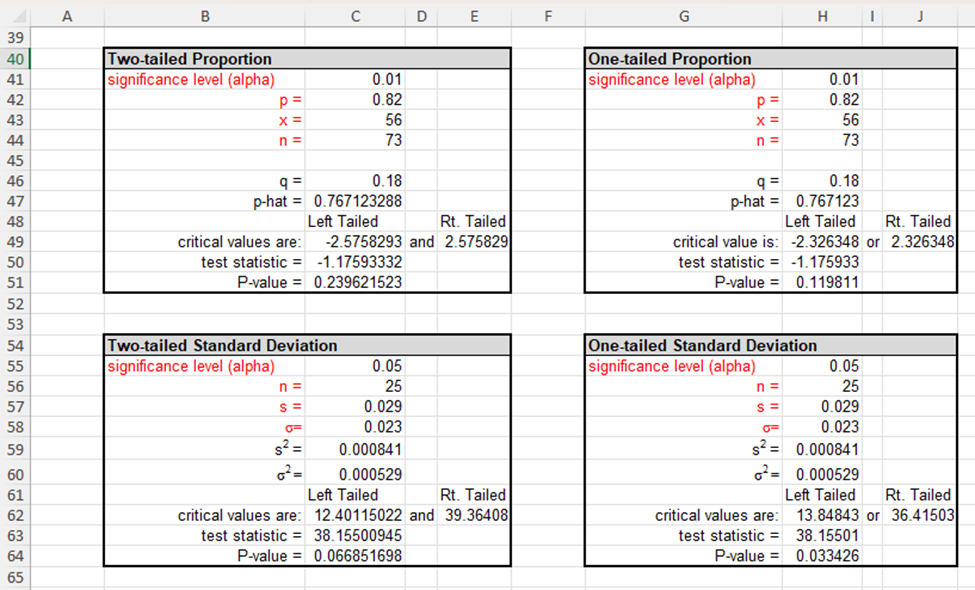
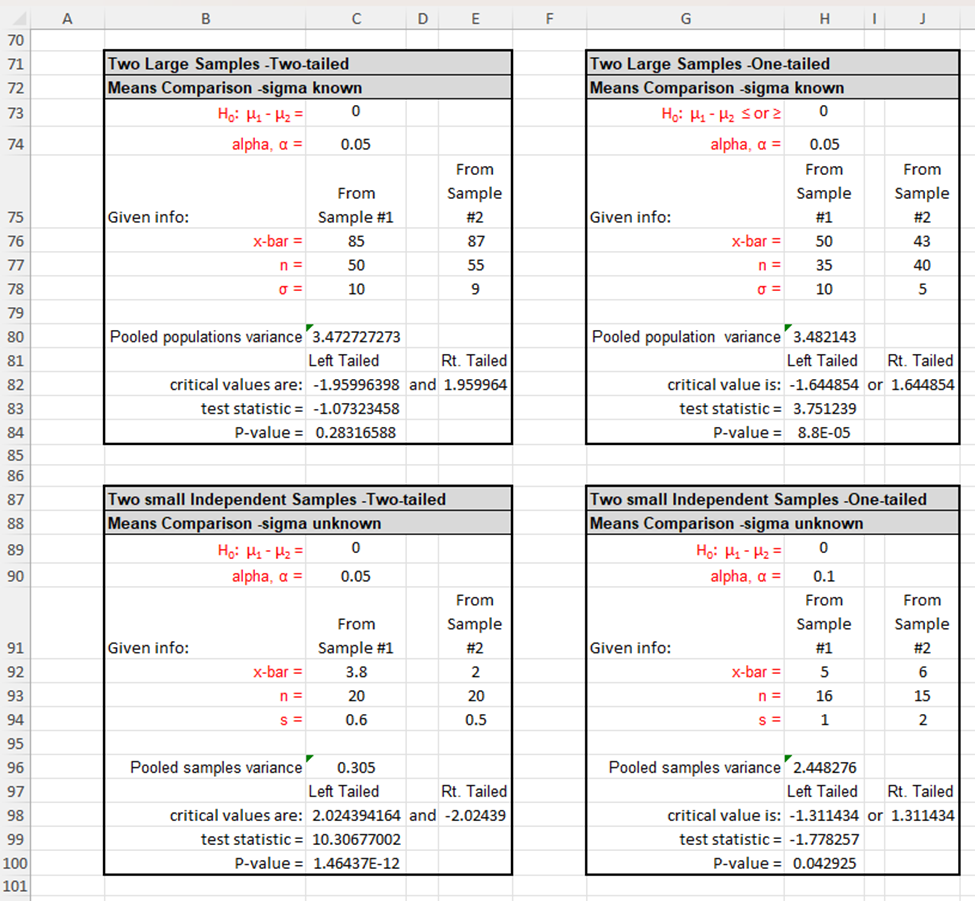
16 |Also, note that the templates for hypothesis testing provided in the Excel Guides for this unit are given in the next worksheet 17 lin this document--see folder tabs at the bottom of the sheet. You may use these templates by copying from the second 18 lworksheet, pasting the copy to the right of the associated problem, then calculating or entering values as needed. 20 21 22 1. Determine whether the following statements are True or False. Then, explain why. 23 (a) Throughout a hypothesis test, the alternative hypothesis is assumed to be true. 24 25 26 (b) No matter what the conclusion of a hypothesis test is, neither the null or alternative hypothesis has been proven to be true. 27 28 29 30 (c) When drawing a conclusion to a hypothesis test, compare the calculated p-value to the calculated test statistic. 31 32 33 (d) As a p-value approaches 0 it is more likely the hypothesis test conclusion will be "reject the null hypothesis." 34 35 36 37 2. A hypothesis test is used to test a claim. On a right-tailed hypothesis test with a 1.6257 critical value, the collected sample's 38 test statistic is calculated to be 1.3994. Which of the following is the correct decision statement for the test? 39 40 a. Claim the null hypothesis is true 41 b. Claim the alternative hypothesis is true 42 c. Reject the null hypothesis 43 d. Fail to reject the null hypothesis 44 45 3. A P-value of 1.018943E-06 is calculated on a hypothesis test with a significance level set at 0.01. Which of the following is the 46 correct conclusion for the test? 47 48 a. Claim the null hypothesis is true 49 b. Claim the alternative hypothesis is true 50 c. Reject the null hypothesis 51 d. Fail to reject the null hypothesis 53 55 56 57 58 59 61 62 63 65 66 67 69 71 2 73 74 75 76 78 80 81 82 83 86 87 88 89 S0 91 92 C D E F G 2] 1 J K 4. Which of the following are not requirements for using the -distribution for a hypothesis test concerning p? (More than one answer may be correct.) a. The data must be qualitative. b. Population must be normally distributed or sample size must be greater than 30 c. The population standard deviation must be known. d. The data is obtained from a random sample of size n. 5. Sleep apnea is a condition in which the sufferers stop breathing momentarily while they are asleep. This condition results in lack of sleep and extreme fatigue during waking hours. A current estimate is that 18 million out of 312.7 million Americans suffer from sleep apnea, or approximately 5.8%. A safety commission is concerned about the percentage of commercial truck drivers who suffer from sleep apnea. They do not have any reason to believe that it would be higher or lower in than the population's percentage. To test the claim that the percentage of commercial truck drivers who suffer from sleep apnea is not 5.8%, a simple random sample of 350 commercial truck drivers is examined by a medical expert, who concludes that 30 suffer from sleep apnea. Does this evidence support the claim that the percentage of commercial truck drivers who suffer from sleep a. In establishing a statistical hypothesis test of this situation, give the required null and alternative hypotheses for a test of the claim that was made. Use correct mathematical symbols. Hq: H;: b. Based on your answer in part a, should you use a right-tailed, a left-tailed, or a two-tailed test? Explain how one determines when each of the three possibilities is to be used. c. Describe the possible Type | error for this situation--make sure to state the error in terms of the context, that is the percentage of commercial truck drivers who suffer from sleep apnea. d. Describe the possible Type Il error for this situation--make sure to state the error in terms of the context, that is the percentage of commercial truck drivers who suffer from sleep apnea. o B C D E F | G | H | 1 | J K 96 e. Determine the appropriate critical value(s) for this situation given a 0.05 significance level. 97 98 99 100 101 102 103 104 g. Determine the P-value. 105 106 107 108 h. CONCLUSION OF HYPOTHESIS TEST BASED ON TEST STATISTIC AND P-VALUE AND EXPLAIN WHY: Write a 109 sentence using the statistics found in the template you chose stating if you will "reject\" or "fail to reject\" the null 110 hypothesis and explaining why. 111 112 113 114 115 116 117 118 119 120 121 6. One cable company claims that it has excellent customer service. In fact, the company advertises that a technician will arrive in 122 approximately 30 minutes after a service call is placed. One frustrated customer believes this is not accurate, claiming that it 123 takes over 30 minutes for the cable technician to arrive. The customer askes a simple random sample of 20 other cable 124 customers how long it has taken for the cable technician to arrive when they have called for one. Test the customer's claim at 125 the 0.025 level of sianificance. 126 Amount of Time Customers Waited for Cable Company | 127 32 31 23 29 38 128 | 2% | 3 | 32 [ 33 | 3 | 129 | 37 | 338 | 34 | 36 | 35 | 130 131 129 . Determine/calculate the value of the sample's test statistic. . FINAL INTERPRETIVE SENTENCE: Write a final interpretive sentence for the context of this problem. Bl e D | E | F | G | H [ I | J | K 132 133 a. Give the null and alternative hypotheses for this test. Use correct mathematical symbols. 134 Hyg: 135 Hy: 136 137 b. Determine the value of the test statistic. 138 139 140 141 142 c. Determine the appropniate critical value(s). 143 144 145 146 d Determine the P-value. 147 148 149 150 e. CONCLUSION OF HYPOTHESIS TEST BASED ON TEST STATISTIC AND P-VALUE AND EXPLAIN WHY: Write a 151 sentence using the statistics found in the template you chose. 152 153 154 155 156 f. FINAL INTERPRETIVE SENTENCE: Write a final interpretive sentence for the context of this problem. 157 158 159 160| 161 162 163 7. Awedding website states that he average cost of a wedding in 2017 was $25,764. One concerned bride hopes that the average 164 is less than reported. To see if her hope is correct, she surveys 55 recently married couples and finds that the average cost of 165 weddings in the sample was $23,015. Assuming that the population standard deviation is $7235, is there sufficient evidence to 166 support the bride's hope at the 0.10 level of significance? 167, 168| B e D E F G H I J K 10| 1 163 7. Awedding website states that he average cost of a wedding in 2017 was $25,764. One concerned bride hopes that the average 164 is less than reported. To see if her hope is correct, she surveys 55 recently married couples and finds that the average cost of 165, weddings in the sample was $23,015. Assuming that the population standard deviation is $7235, is there sufficient evidence to 166 support the bride's hope at the 0.10 level of significance? 167, 168| 169| 170 a. Give the null and alternative hypotheses for this test. Use correct mathematical symbols. 171 Hg: 172 H;: 173 174 b. Determine the value of the test statistic. 175 176 177, 178 c. Determine the appropriate critical value(s). 179 180, 181 182 d Determine the P-value. 183 184 185 186! . CONCLUSION OF HYPOTHESIS TEST BASED ON TEST STATISTIC AND P-VALUE AND EXPLAIN WHY: Write a 187, sentence using the statistics found in the template you chose. 188 189 190 f. FINAL INTERPRETIVE SENTENCE: Write a final interpretive sentence for the context of this problem. 191 192 193 B C D E 3 G H I J K 196 8. A diary supplier fills hundreds of cartons with milk each day. They are contracted to fill each carton with exactly one gallon of 197 milk. Because of the moving parts on the machine that fills the cartons, the amount of milk dispensed begins to vary slightly 198 over time. When this happens, the machine must be serviced to realign it correctly. When testing the accuracy of the machine, 199 the amount of milk dispensed into each carton sampled is measured in milliliters. A standard deviation of 2 mL. is acceptable. 200 Servicing must occur when the standard deviation is more than 2 mL with a level of significance of 0.01. Twenty-five cartons 201 are randomly chosen to be tested and the amounts of milk in the cartons are found to have a standard deviation of 2.5 mL. 202, 203 a. Give the null and alternative hypotheses for this test. Use correct mathematical symbols. 204 Ho: 205 Hy: 206 207 b. Determine the value of the test statistic. 208 209 210 211 c. Determine the appropriate critical value(s). 212 213 214 215 d Determine the P-value. 216 217 218 219 e. CONCLUSION OF HYPOTHESIS TEST BASED ON TEST STATISTIC AND P-VALUE AND EXPLAIN WHY: Write a 220 sentence using the statistics found in the template you chose. 221 222 223 f. FINAL INTERPRETIVE SENTENCE: Write a final interpretive sentence for the context of this problem. 224 225 226 227 B Cc D E F G H | J K 231 9. An anger-management course claims that, after completing its seminar, participants will lose their tempers less often. Always a 232 skeptic, you decide to test this claim. A random sample of 12 seminar participants is chosen, and these participants are asked 233 to record the number of times they lost their tempers in the two weeks prior to the course. After the course is over, the same 234 participants are asked to record the number of times that they lost their tempers in the next two weeks. The following table lists 235 the results of the survey. Using these data, test the claim at the 0.05 level of significance. 236 237 Data from 12 Anger-Management Course Participants 238 Before Course | After Course 239 9 6 240 9 5 241 10 6 242 4 4 243 4 3 244 7 6 245 10 7 246 6 5 247 6 4 248 6 6 249 3 4 250 5 5 251 252 a. Give the null and alternative hypotheses for this situation. Use correct mathematical symbols. 253 Hy: 254 H;: 255 256 b. Determine the value of the test statistic. 257 258 259 260 c. Determine the appropriate critical value(s). 261 262 263 264 d. Determine the P-value. 265 266 267 268 e. CONCLUSION OF HYPOTHESIS TEST BASED ON TEST STATISTIC AND P-VALUE AND EXPLAIN WHY: Write a 269 sentence using the statistics found in the template you chose. 270 281 282 283 284 285 286 287 288 289 290| 291 292 293 294 295 296 297 298 299 300| 301 302 303 304 305 306| 307 308| 309 310 311 312 313 314 C D E F G H I J K 10. Which of the following statements regarding regression and correlation are true? (There may be more than one correct a. The average error between the actual values and the predicted values of a least squares line will always be near zero. b. When the slope of a linear regression equation is near 0, then the linear correlation between the two variables must also be near 0. c. A positive correlation between two variables implies the slope of the regression line will also be positive. d. Avalue of the linear correlation, r, near -1 means the data is tightly bundled around a line, and predictions within the scope of data are very reliable. 11. For each of the following data sets, choose the most appropriate response from the choices below the table. Data Set #1 Data Set #2 X y 20 -6 -15 -20 18 -2 -1 40 13 -4 -8 22 10 2 -4 30 9 4 0 27 3 6 4 -15 -1 9 3 -12 -4 11 8 f -6 18 1 29 a. A strong positive linear relation exists a. A strong positive linear relation exists b. A strong negative linear relation exists b. A strong negative linear relation exists . No linear relation exists c. No linear relation exists 12. Usina Excel commands. determine the linear correlation coefficient for each dataset in problem #10. Linear Correlation for Data Set #1: Linear Correlation for Data Set #2: B C D E G H K 314 L M N 315 13. A child development class wants to learn more about the growth rate of children. The students visit a local preschool and Preschool Age and Height Data 816 Age (in years] Height (in inches] measure the heights of children. The data in the chart to the right was collected. Use this data to answer the questions below. $17 1.0 29.4 818 1.4 28.3 a. Construct a scatterplot for this data set in the region to the right of the chart of data (use Age as the independent 319 1.8 30.1 variable, and Height as the dependent variable.) Adjust your horizontal and vertical scaling to keep the primary focus 320 2.0 of the graph to the region in which the points lie. Label the axes and make a descriptive title to the display. Add the 34.5 321 trend line and R*2 value to the display. For help, see Unit 3 Excel Guide or video on Bb. 2.3 33.5 322 2.7 34.8 323 b. Based on the scatterplot, does it look like a linear regression model is appropriate for this data? Why or why not? 3.2 37.5 824 3.3 36.0 325 3.5 37.2 326 3.8 39.0 327 4.2 41.3 328 C. Give the equation of the trend line below. 4.4 44.1 329 4.8 44.5 330 5.2 46.1 331 332 d. Give the slope value of the line and explain its meaning to this context of this problem. 333 336 337 3381 e. Determine the value of the correlation coefficient. Explain what this value tells you about the two variables. 339 340 341 342 343 344 f. What is the value of the coefficient of determination for this paired data? Explain what this value tells you regarding 345 these two variables. 346 347 348336 337 338 339 341 342 343 347 349 350 351 352 353 354 355 356 357, 358 359 360 361 362 363 364 365 . Determine the value of the correlation coefficient. Explain what this value tells you about the two variables. . What is the value of the coefficient of determination for this paired data? Explain what this value tells you regarding these two variables. . Based on the linear regression equation, what is the predicted height for a preschooler who is 3 years old? Show your calculation. - If a preschooler is 43 inches tall. what would be the preschool's predicted age? . Explain what the problem would be to use this model to predict the height of someone who is 21 years old? 00~ v L0 BN 11 12 13 14 15 16 17 18 19 20 21 22 23 24 25 26 27 28 29 30 31 32 33 35 36 37 38 B C E G H I J You should use these templates to help you on your text/HLS problems, activities, as well as with the set of practice problems. These templates will be provided as below within the Excel sheet for use on the Unit 3 exam and on the final. To use the templates correctly: 1. Based on the claim in the problem, highlight the correct template you need including the title and select control-c to copy. 2. Go back to the right of the problem you are working and paste the template using control-v. 3. Enter the values related to the labels in red. If the template asks for x-bar or s, calculate those values using Excel commands within the template. DO NOT ENTER ROUNDED VALUES INTO THE TEMPLATE. Two-tailed Mean (sigma known) significance level (alpha) 0.05 x-bar = 24 85 mu, g = 24 sigma, 0 = 2 n= 25 Left Tailed Rt. Tailed critical values are: -1.95996398 and 1.959964 test statistic = 2125 P-value = 0.033586613 Two-tailed Mean (sigma unknown significance level (alpha) x-bar = mu, g = S = n = Left Tailed Rt. Tailed critical values are: -2.09302405 and 2.093024 test statistic = -2.98142397 P-value = 0.007670613 One-tailed Mean (sigma known) significance level (alpha) 0.05 x-bar = 24 85 mu, p = 24 sigma, 0 = 2 n= 25 Left Tailed Rt. Tailed critical value is: -1.644854 or 1.644854 test statistic = 2125 P-value = 0.016793 One-tailed Mean (sigma unknown significance level (alpha) i x-bar = Left Tailed Rt. Tailed critical value is: -1.729133 or 1.729133 test statistic = -2.981424 P-value = 0.003835 significance level (alpha) 0.01 p= 082 X = 56 n= 73 q= 0.18 phat = 0767123288 Left Tailed critical values are: -2.5758293 and 2575829 test statistic = -1.17593332 P-value = 0.239621523 Two-tailed Standard Deviation significance level (alpha) 0.05 n= 25 s = 0.029 o= 0.023 2 0.000841 0.000529 Left Tailed g* = 2 o= critical values are: 12.40115022 and 39.36408 test statistic = 38.15500945 P-value = 0.066851698 Rt. Tailed Rt. Tailed Left Tailed Rt. Tailed critical value is: -2.326348 or 2326348 test statistic = -1.175933 P-value = 0.119811 significance level (alpha) 0.05 25 0.029 0.023 s?= 0.000841 o'= 0.000529 Left Tailed Rt Tailed critical values are: 13.84843 or 36.41503 test statistic = 38.15501 P-value = 0.033426 A B C D E F H 70 71 Two Large Samples -Two-tailed Two Large Samples -One-tailed 72 Means Comparison -sigma known Means Comparison -sigma known 73 Ho: H1 - H2 = Ho: H1 - H2 Sorz 74 alpha, a = 0.05 alpha, a = 0.05 From From From From Sample Sample Sample 75 Given info: Sample #1 #2 Given info: #1 #2 76 x-bar = 85 87 x-bar = 50 43 77 n= 50 55 n= 35 40 78 10 9 0= 10 5 79 80 Pooled populations variance 3.472727273 Pooled population variance 3.482143 81 Left Tailed Rt. Tailed Left Tailed Rt. Tailed 82 critical values are: -1.95996398 and 1.959964 critical value is: -1.644854 or 1.644854 83 test statistic = -1.07323458 test statistic = 3.751239 84 P-value = 0.28316588 P-value = 8.8E-05 85 86 87 Two small Independent Samples -Two-tailed Two small Independent Samples -One-tailed 88 Means Comparison -sigma unknown Means Comparison -sigma unknown 89 Ho: H1 - H2 = 0 Ho: M1 - H2 = 0 90 alpha, a = 0.05 alpha, a = 0.1 From From From From Sample Sample Sample 91 Given info: Sample #1 #2 Given info: #1 #2 92 x-bar = 3.8 2 x-bar = 5 6 93 n= 20 20 n = 16 15 94 S= 0.6 0.5 S= 1 2 95 96 Pooled samples variance 0.305 Pooled samples variance 2.448276 97 Left Tailed Rt. Tailed Left Tailed Rt. Tailed 98 critical values are: 2.024394164 and -2.02439 critical value is: -1.311434 or 1.311434 99 test statistic = 10.30677002 test statistic = -1.778257 100 P-value = 1.46437E-12 P-value = 0.042925 101
Step by Step Solution
There are 3 Steps involved in it

Get step-by-step solutions from verified subject matter experts


