

Answered step by step
Verified Expert Solution
Question
1 Approved Answer
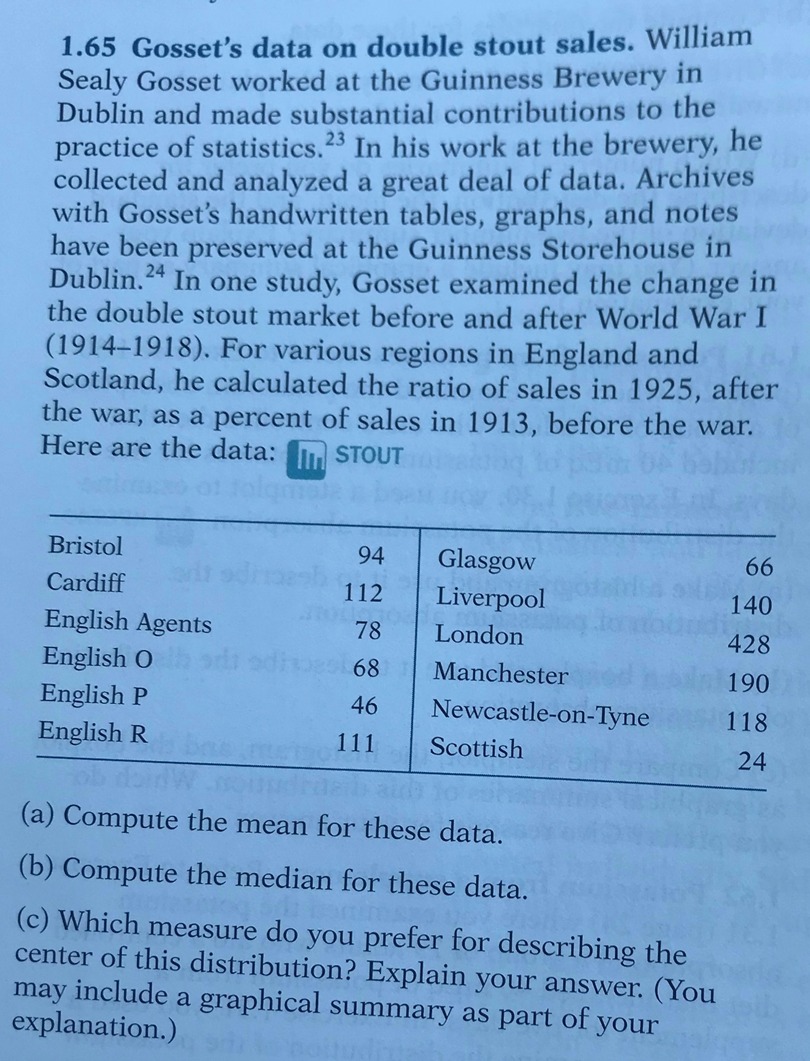
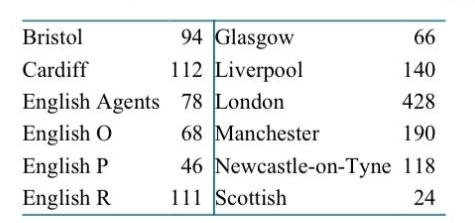
1.65 Gosset's data on double stout sales. William Sealy Gosset worked at the Guinness Brewery in Dublin and made substantial contributions to the practice of

Step by Step Solution
There are 3 Steps involved in it
Step: 1

Get Instant Access to Expert-Tailored Solutions
See step-by-step solutions with expert insights and AI powered tools for academic success
Step: 2

Step: 3
Ace Your Homework with AI
Get the answers you need in no time with our AI-driven, step-by-step assistance
Get Started
Linear Algebra With Applications
Authors: Gareth Williams, Williams
9th Edition
1284120104, 9781284120103