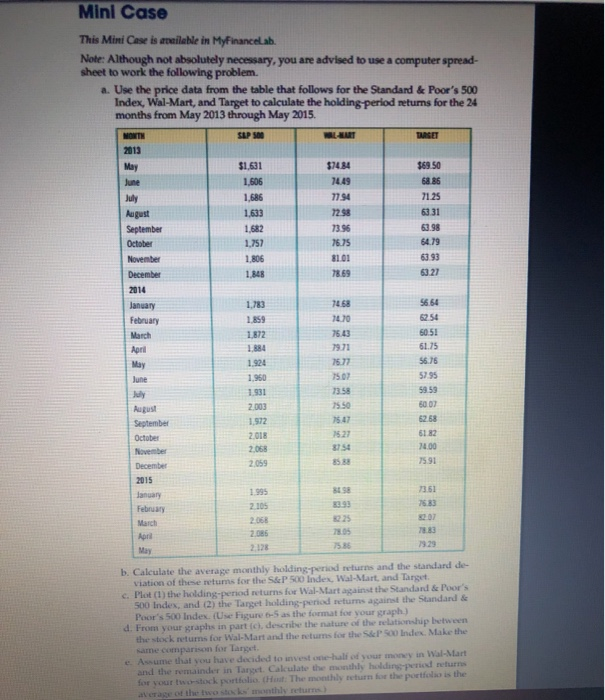
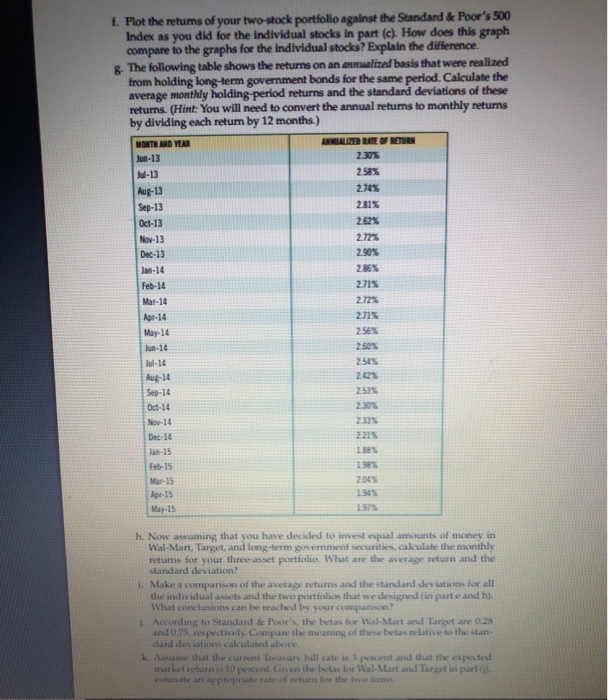
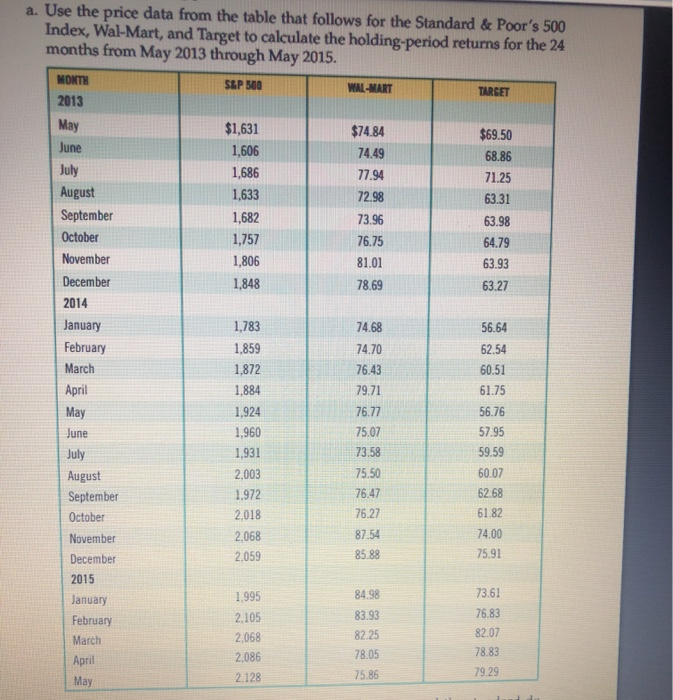
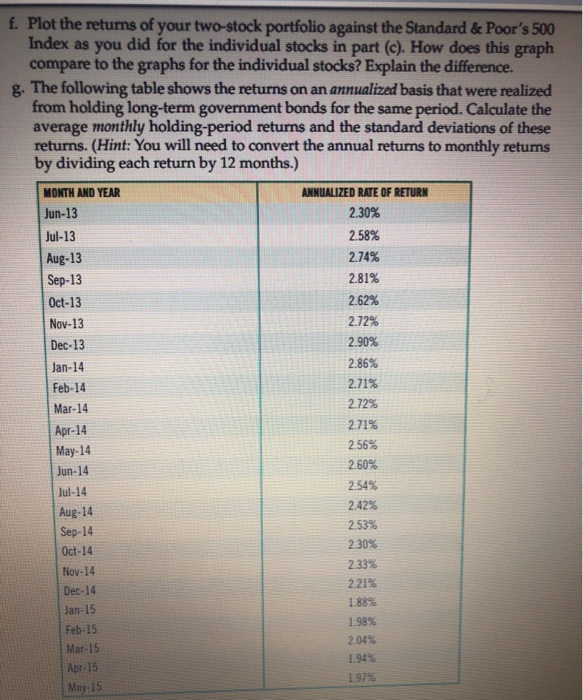
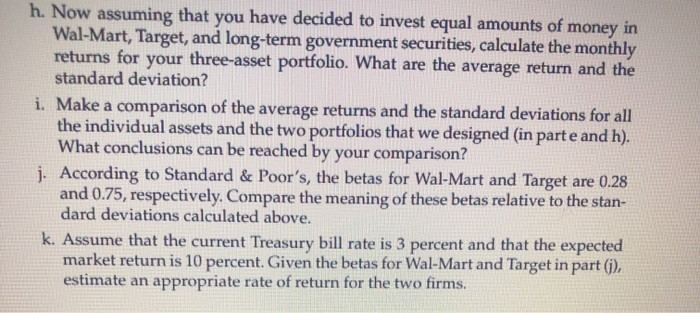
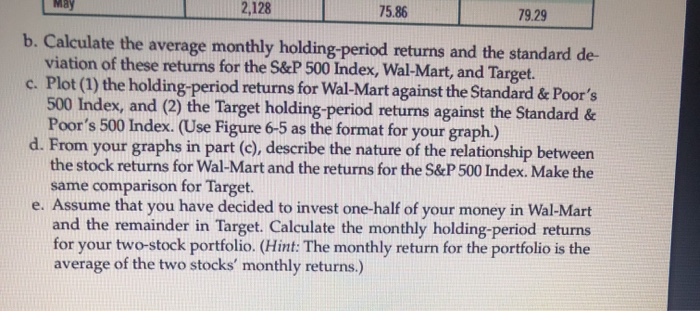
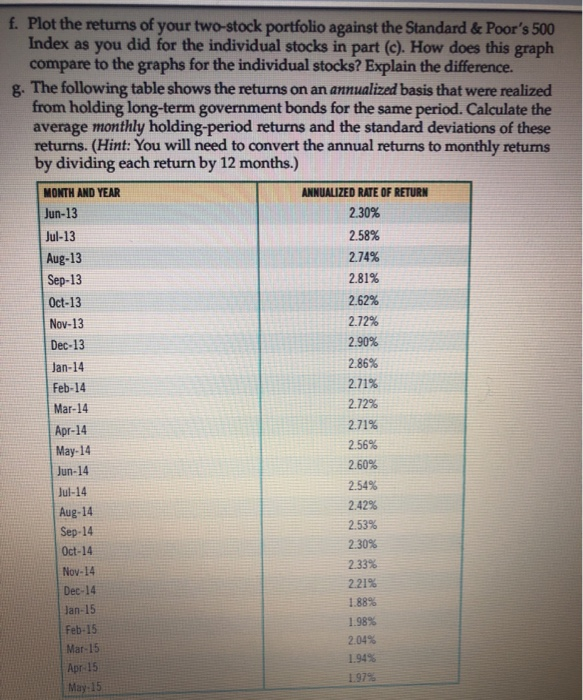
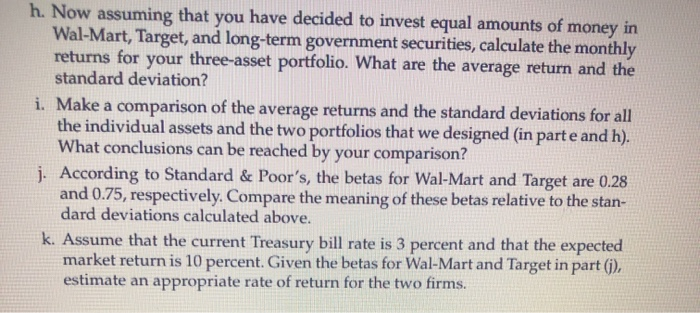
17.30 Mini Case This Mini Case is available in MyFinanceLab. Note: Although not absolutely necessary, you are advised to use a computer spread- sheet to work the following problem. a. Use the price data from the table that follows for the Standard & Poor's 500 Index, Wal-Mart, and Target to calculate the holding period returns for the 24 months from May 2013 through May 2015 MONT SEP 500 TAASET 2013 May $1,631 $74.84 $69.50 June 1,606 74.49 68.86 July 1,686 71.25 August 1,633 7298 63.31 September 1,682 73.96 63.98 October 1,757 76.75 64.79 November 1.806 81.01 6393 December 1,848 78.69 63.27 2014 January 1.783 14.68 56.64 February 14.70 March 1,872 76.13 50.51 April 1.884 79.71 61.75 May 1.924 75.77 56.76 June 1.960 7507 57.95 July 1.931 73.58 59.59 August 2.003 15.50 5007 September 1.972 75.47 62.68 October 2018 1527 61 82 November 2.068 8154 14.00 December 2.059 75.91 2015 January 1.995 73.61 February 2.105 7583 March 2.068 April 2.085 May 2.128 75.80 7929 b. Calculate the average monthly holding period returns and the standard de viation of these retums for the S&P 500 Index, Wal-Mart, and Target c. Plot (1) the holding period returns for Wal-Mart against the Standard & Poor's 500 Index, and (2) the Target holding period returns against the Standard & Poor's 500 Index. (Use Figure -5 as the format for your graph) d. From your graphs in parte, describe the nature of the relationship between the stock returns for Wal-Mart and the returns for the S&P 500 Index. Make the same comparison for Target e. Assume that you have decided to invest one-hallod your money in Wal-Mart and the remainder in Target Calculate the monthly holdins-period returns for your two-stock portfolio Hout: The monthly return for the portfolio is the f. Plot the retums of your two stock portfolio against the Standard & Poor's 500 Index as you did for the individual stocks in part (c). How does this graph compare to the graphs for the individual stocks? Explain the difference. 8. The following table shows the returns on an annualized basis that were realized from holding long-term government bonds for the same period. Calculate the average monthly holding period returns and the standard deviations of these returns. (Hint: You will need to convert the annual retums to monthly returns by dividing each return by 12 months.) MONTH AND YEAR ANALIZED LATE OF RETURN Jun-13 230% 2.58% Aug-13 2.74% Sep-13 281% Oct-13 Nov-13 2.72% Dec-13 2.90% Jan-14 2.86% Feb-14 2.715 Mar-14 Apr-14 2.71% May-14 2.56% Jun-10 2.50% Jul-14 254 2.62 Sep-14 2.53% Oct-14 2.30% 2335 Dec-10 2.215 Jan-15 188% Feb-15 1983 Mar-15 2009 Apr-15 1945 May-15 Aug-14 h. Now assuming that you have decided to invest equal amount of money in Wal-Mart, Target, and long-term government securities, calculate the monthly retums for your three-asset portfolio. What are the average return and the standard deviation? i. Make a comparison of the average retums and the standard deviations for all the individual assets and the two portfolios that we designed (in parte and h). What conclusions can be reached by your comparison 1. According to Standard & Poor's, the beas for Wal-Mart and Target are 0.28 and 0.75, respectively. Compare the meaning of these betas relative to the stan- dard deviations calculated above. L. Asume that the current Treasury bill rate is 3 percent and that the expected market return is 10 percent. Given the belas for Wal-Mart and Target in part (1) estimate an appropriate rate of return for the two fimm a. Use the price data from the table that follows for the Standard & Poor's 500 Index, Wal-Mart, and Target to calculate the holding-period returns for the 24 months from May 2013 through May 2015. MONTH S&P 500 WAL-MART TARGET 2013 May $1,631 $74.84 $69.50 June 1,606 74.49 68.86 July 1,686 77.94 71.25 August 1,633 72.98 63.31 September 1,682 73.96 63.98 October 1,757 76.75 64.79 November 1,806 81.01 63.93 December 1,848 78.69 63.27 2014 January 1,783 74.68 56.64 February 1.859 74.70 62.54 March 1,872 76.43 60.51 April 1,884 79.71 61.75 May 1.924 76.77 56.76 June 1,960 75.07 57.95 July 1,931 73.58 59.59 August 2,003 75.50 60.07 September 1,972 76.47 62.68 2018 76 27 October 61.82 November 2,068 87.54 74.00 2,059 85.88 December 75.91 2015 1.995 84.98 January 73.61 83.93 76.83 February 2.105 82.25 82.07 March 2.068 78.05 78.83 2,086 April 75.86 79.29 May 2.128 May 2,128 75.86 79.29 b. Calculate the average monthly holding-period returns and the standard de viation of these returns for the S&P 500 Index, Wal-Mart, and Target. c. Plot (1) the holding-period returns for Wal-Mart against the Standard & Poor's 500 Index, and (2) the Target holding-period returns against the Standard & Poor's 500 Index. (Use Figure 6-5 as the format for your graph.) d. From your graphs in part (c), describe the nature of the relationship between the stock returns for Wal-Mart and the returns for the S&P 500 Index. Make the same comparison for Target. e. Assume that you have decided to invest one-half of your money in Wal-Mart and the remainder in Target. Calculate the monthly holding-period returns for your two-stock portfolio. (Hint: The monthly return for the portfolio is the average of the two stocks' monthly returns.) f. Plot the returns of your two-stock portfolio against the Standard & Poor's 500 Index as you did for the individual stocks in part (C). How does this graph compare to the graphs for the individual stocks? Explain the difference. g. The following table shows the returns on an annualized basis that were realized from holding long-term government bonds for the same period. Calculate the average monthly holding-period returns and the standard deviations of these returns. (Hint: You will need to convert the annual returns to monthly returns by dividing each return by 12 months.) MONTH AND YEAR ANNUALIZED RATE OF RETURN Jun-13 2.30% Jul-13 2.58% Aug-13 2.74% Sep-13 2.81% Oct-13 2.62% Nov-13 2.72% Dec-13 2.90% Jan-14 2.86% Feb-14 2.71% Mar-14 2.72% Apr-14 May-14 2.56% 2.60% Jul-14 2.54% Aug-14 2.42% Sep-14 2.53% Oct-14 2.30% 2.33% 2.21% 1.88% Feb-15 1.98% Mar-15 2.04% 1.949 Apr 15 1.97% May 15 2.71% Jun-14 Nov-14 Dec-14 Jan-15 h. Now assuming that you have decided to invest equal amounts of money in Wal-Mart, Target, and long-term government securities, calculate the monthly returns for your three-asset portfolio. What are the average return and the standard deviation? i. Make a comparison of the average returns and the standard deviations for all the individual assets and the two portfolios that we designed (in parte and h). What conclusions can be reached by your comparison? j. According to Standard & Poor's, the betas for Wal-Mart and Target are 0.28 and 0.75, respectively. Compare the meaning of these betas relative to the stan- dard deviations calculated above. k. Assume that the current Treasury bill rate is 3 percent and that the expected market return is 10 percent. Given the betas for Wal-Mart and Target in part (1), estimate an appropriate rate of return for the two firms. a. Use the price data from the table that follows for the Standard & Poor's 500 Index, Wal-Mart, and Target to calculate the holding-period returns for the 24 months from May 2013 through May 2015. MONTH S&P 500 WAL-NART TARGET 2013 May $1,631 $74.84 $69.50 June 1,606 74.49 68.86 July 1,686 77.94 71.25 August 1,633 72.98 63.31 September 1,682 73.96 63.98 October 1,757 76.75 64.79 November 1,806 81.01 63.93 December 1,848 78.69 63.27 2014 January 1,783 74.68 56.64 February 1,859 74.70 62.54 March 1,872 60.51 April 1,884 79.71 61.75 May 1.924 76.77 56.76 June 1,960 75.07 57.95 July 1,931 73.58 59.59 August 2,003 75.50 60.07 1,972 76.47 September 62.68 October 61.82 2,018 76.27 2,068 87.54 November 74.00 2,059 85.88 December 75.91 76.43 2015 84.98 January February March April May 1.995 2.105 2.068 2,086 83.93 82.25 78.05 75.86 73.61 76.83 82.07 78.83 79.29 2,128 May 2,128 75.86 79.29 b. Calculate the average monthly holding-period returns and the standard de viation of these returns for the S&P 500 Index, Wal-Mart, and Target. c. Plot (1) the holding-period returns for Wal-Mart against the Standard & Poor's 500 Index, and (2) the Target holding-period returns against the Standard & Poor's 500 Index. (Use Figure 6-5 as the format for your graph.) d. From your graphs in part (c), describe the nature of the relationship between the stock returns for Wal-Mart and the returns for the S&P 500 Index. Make the same comparison for Target. e. Assume that you have decided to invest one-half of your money in Wal-Mart and the remainder in Target. Calculate the monthly holding-period returns for your two-stock portfolio. (Hint: The monthly return for the portfolio is the average of the two stocks' monthly returns.) f. Plot the returns of your two-stock portfolio against the Standard & Poor's 500 Index as you did for the individual stocks in part (C). How does this graph compare to the graphs for the individual stocks? Explain the difference. g. The following table shows the returns on an annualized basis that were realized from holding long-term government bonds for the same period. Calculate the average monthly holding-period returns and the standard deviations of these returns. (Hint: You will need to convert the annual returns to monthly returns by dividing each return by 12 months.) MONTH AND YEAR ANNUALIZED RATE OF RETURN Jun-13 2.30% Jul-13 2.58% Aug-13 2.74% Sep-13 2.81% Oct-13 2.62% Nov-13 2.72% Dec-13 2.90% Jan-14 2.86% Feb-14 2.71% Mar-14 2.72% Apr-14 2.71% May-14 2.56% Jun-14 2.60% Jul-14 2.54% Aug-14 2.42% Sep-14 2.53% Oct-14 2.30% Nov-14 2.33% Dec-14 2.21% Jan-15 1.88% Feb-15 1.98% Mar-15 2.04% 1.94% Apr 15 May:15 1.97% h. Now assuming that you have decided to invest equal amounts of money in Wal-Mart, Target, and long-term government securities, calculate the monthly returns for your three-asset portfolio. What are the average return and the standard deviation? i. Make a comparison of the average returns and the standard deviations for all the individual assets and the two portfolios that we designed (in parte and h). What conclusions can be reached by your comparison? j. According to Standard & Poor's, the betas for Wal-Mart and Target are 0.28 and 0.75, respectively. Compare the meaning of these betas relative to the stan- dard deviations calculated above. k. Assume that the current Treasury bill rate is 3 percent and that the expected market return is 10 percent. Given the betas for Wal-Mart and Target in part (1), estimate an appropriate rate of return for the two firms