

Answered step by step
Verified Expert Solution
Question
1 Approved Answer
1.7wo years of financial statement data for the Barcelona Export Corporation are shown belowe BARCELONA EXPORTS CORPORATION Balance Sheet Cash Accounts Receivables Inventories Total Current
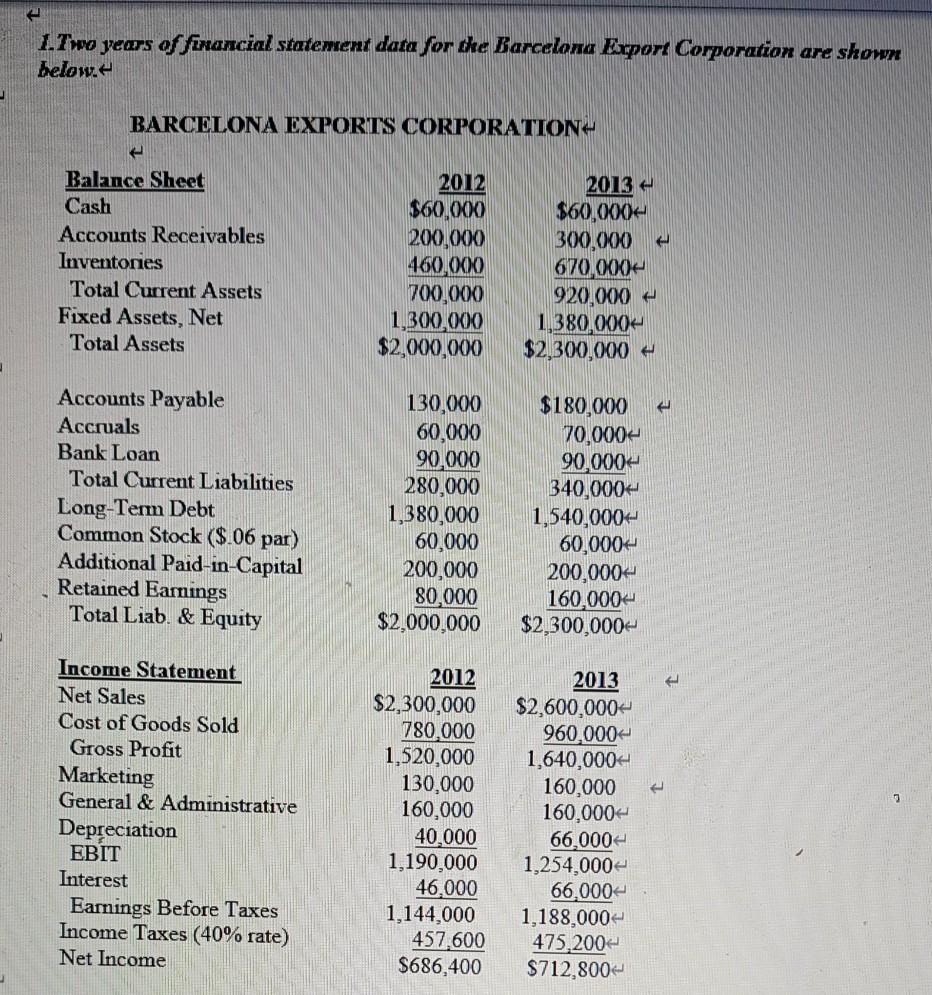
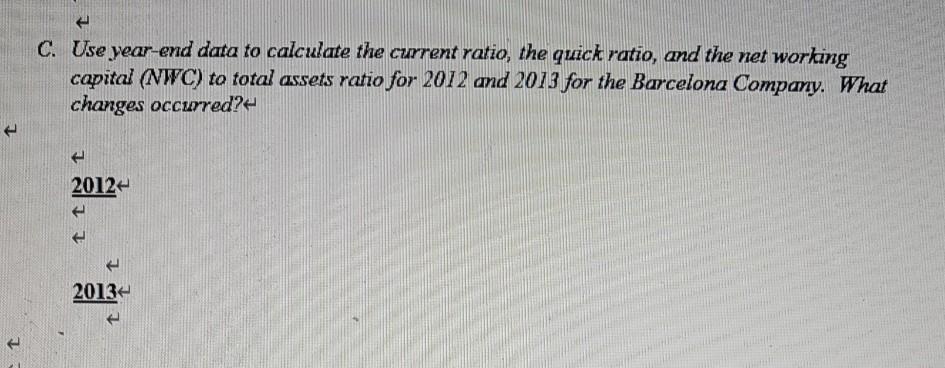
1.7wo years of financial statement data for the Barcelona Export Corporation are shown belowe BARCELONA EXPORTS CORPORATION Balance Sheet Cash Accounts Receivables Inventories Total Current Assets Fixed Assets, Net Total Assets 2012 $60,000 200,000 460,000 700,000 1,300,000 $2,000,000 2013 - $60,000+ 300,000 670,000 920,000 - 1,380,000 $2,300,000 - Accounts Payable Accruals Bank Loan Total Current Liabilities Long-Term Debt Common Stock ($ 06 par) Additional Paid-in-Capital Retained Earnings Total Liab. & Equity 130,000 60,000 90.000 280,000 1,380,000 60,000 200,000 80,000 $2,000,000 $180,000 70,000- 90,000 340,000+ 1,540,000 60,000 200,000 160,000 $2,300,000 3 Income Statement Net Sales Cost of Goods Sold Gross Profit Marketing General & Administrative Depreciation EBIT Interest Earnings Before Taxes Income Taxes (40% rate) Net Income 2012 $2,300,000 780,000 1,520,000 130,000 160,000 40,000 1,190,000 46,000 1,144,000 457.600 $686,400 2013 $2,600,000 960,000 1,640,000+ 160,000 160,000 66,000+ 1,254,000 66,000+ 1,188,000 475.2004 $712,800 C. Use year-end data to calculate the current ratio, the quick ratio, and the net working capital (NWC) to total assets ratio for 2012 and 2013 for the Barcelona Company. What changes occurred? 2012- 2013
Step by Step Solution
There are 3 Steps involved in it
Step: 1

Get Instant Access to Expert-Tailored Solutions
See step-by-step solutions with expert insights and AI powered tools for academic success
Step: 2

Step: 3
Ace Your Homework with AI
Get the answers you need in no time with our AI-driven, step-by-step assistance
Get Started
ABC Finance Coloring Book Familys First Financial Literacy Book
Authors: Jason Conger
1st Edition
1955961026, 978-1955961028