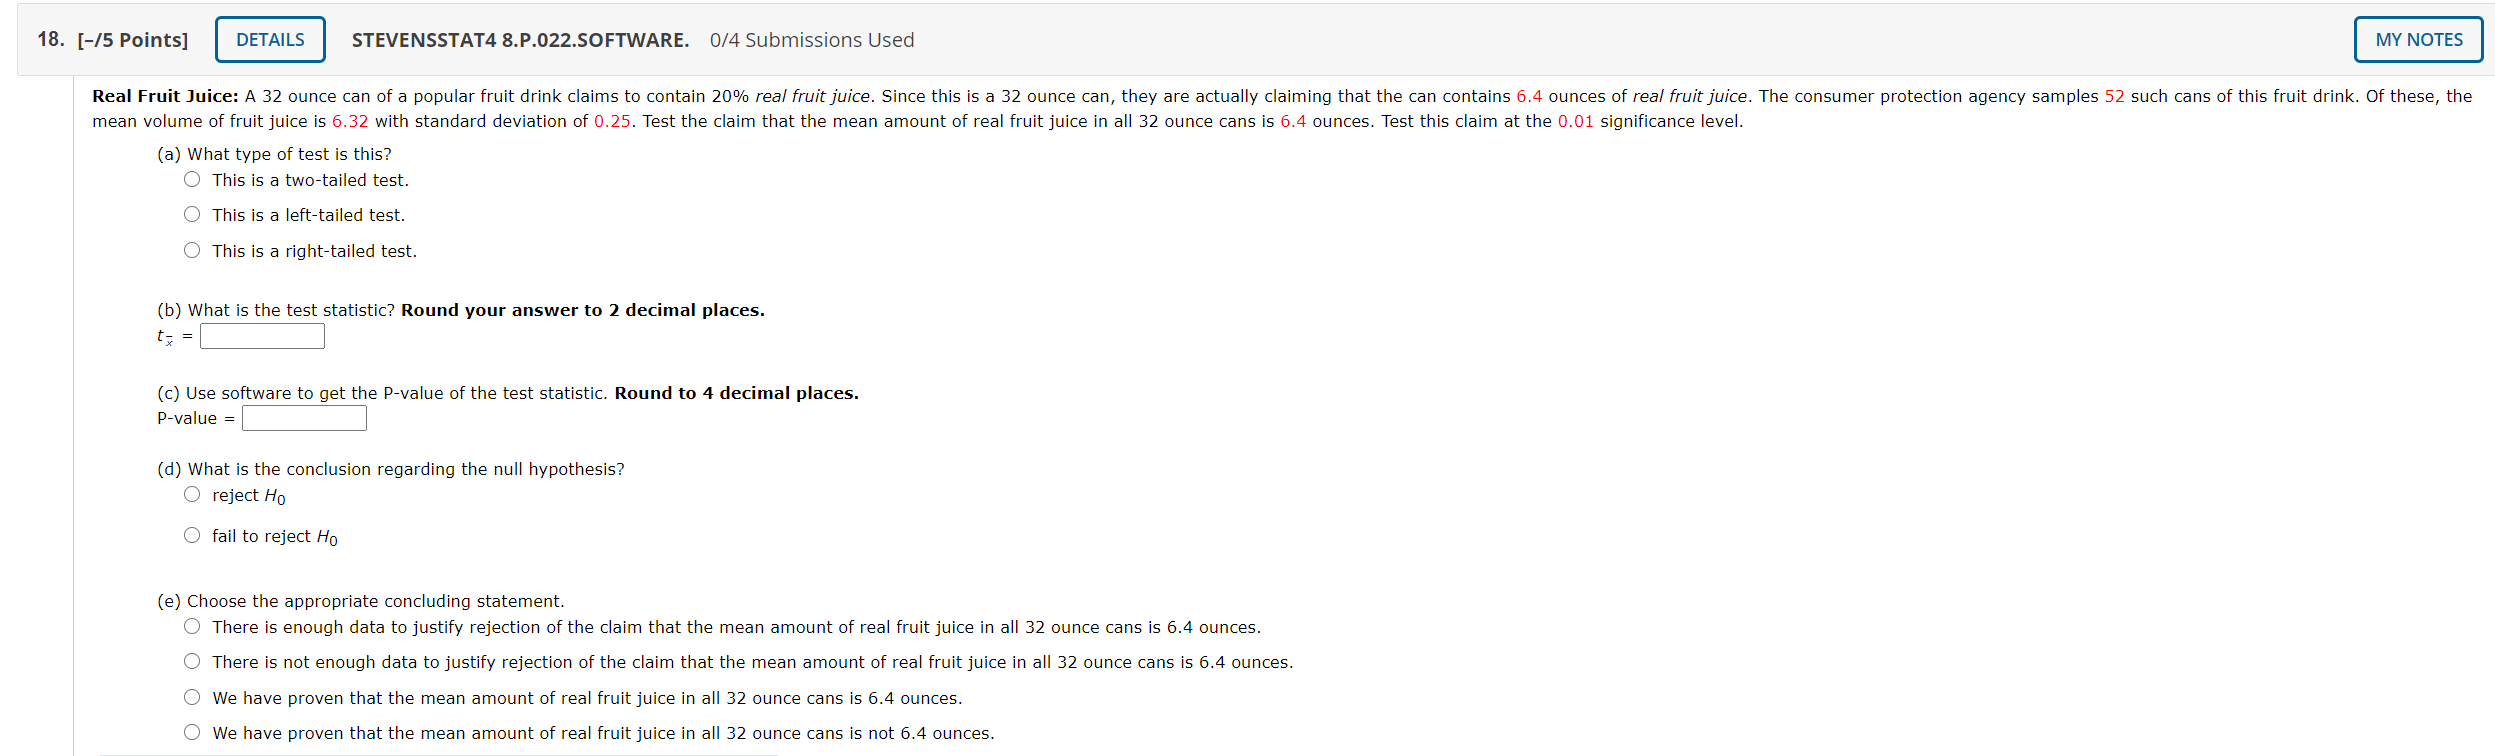
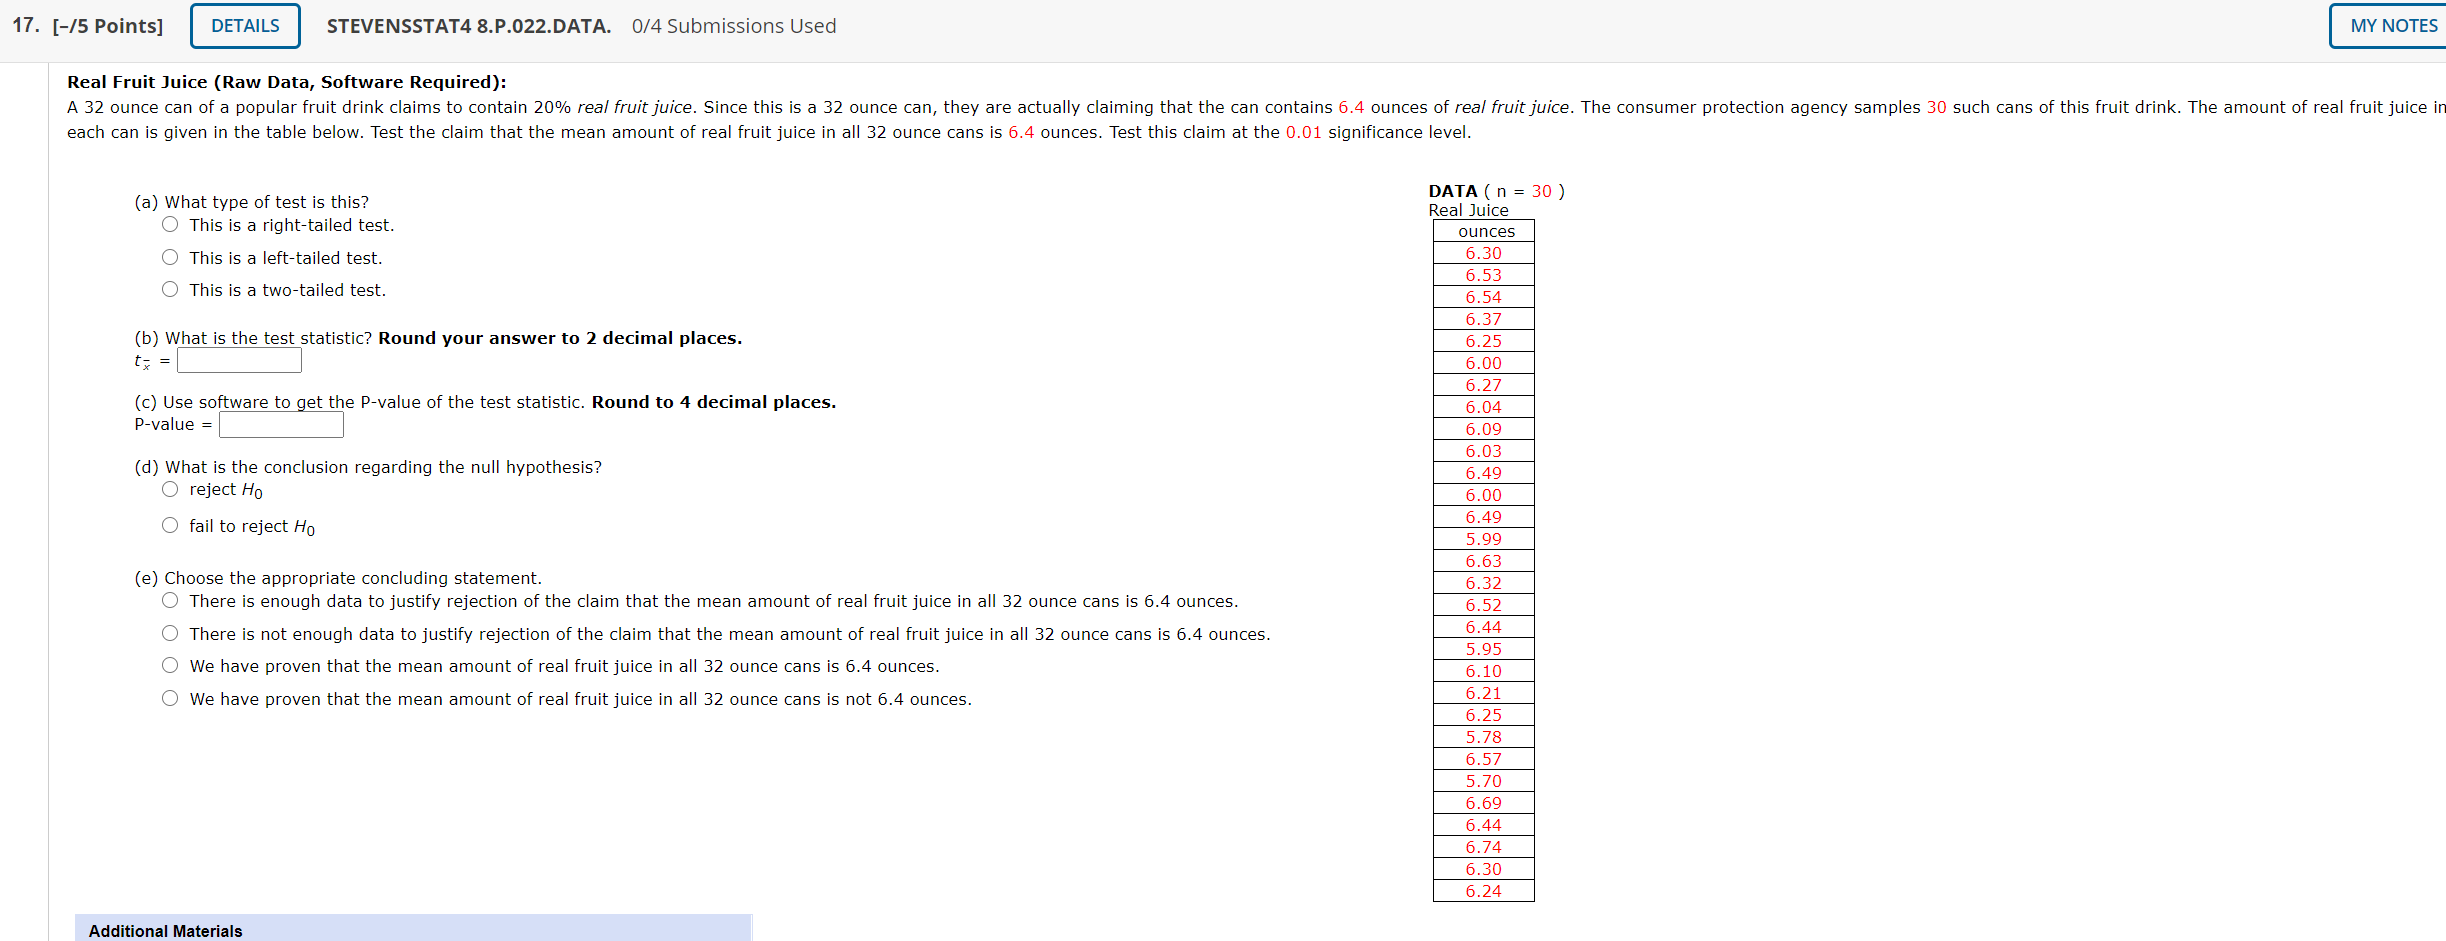
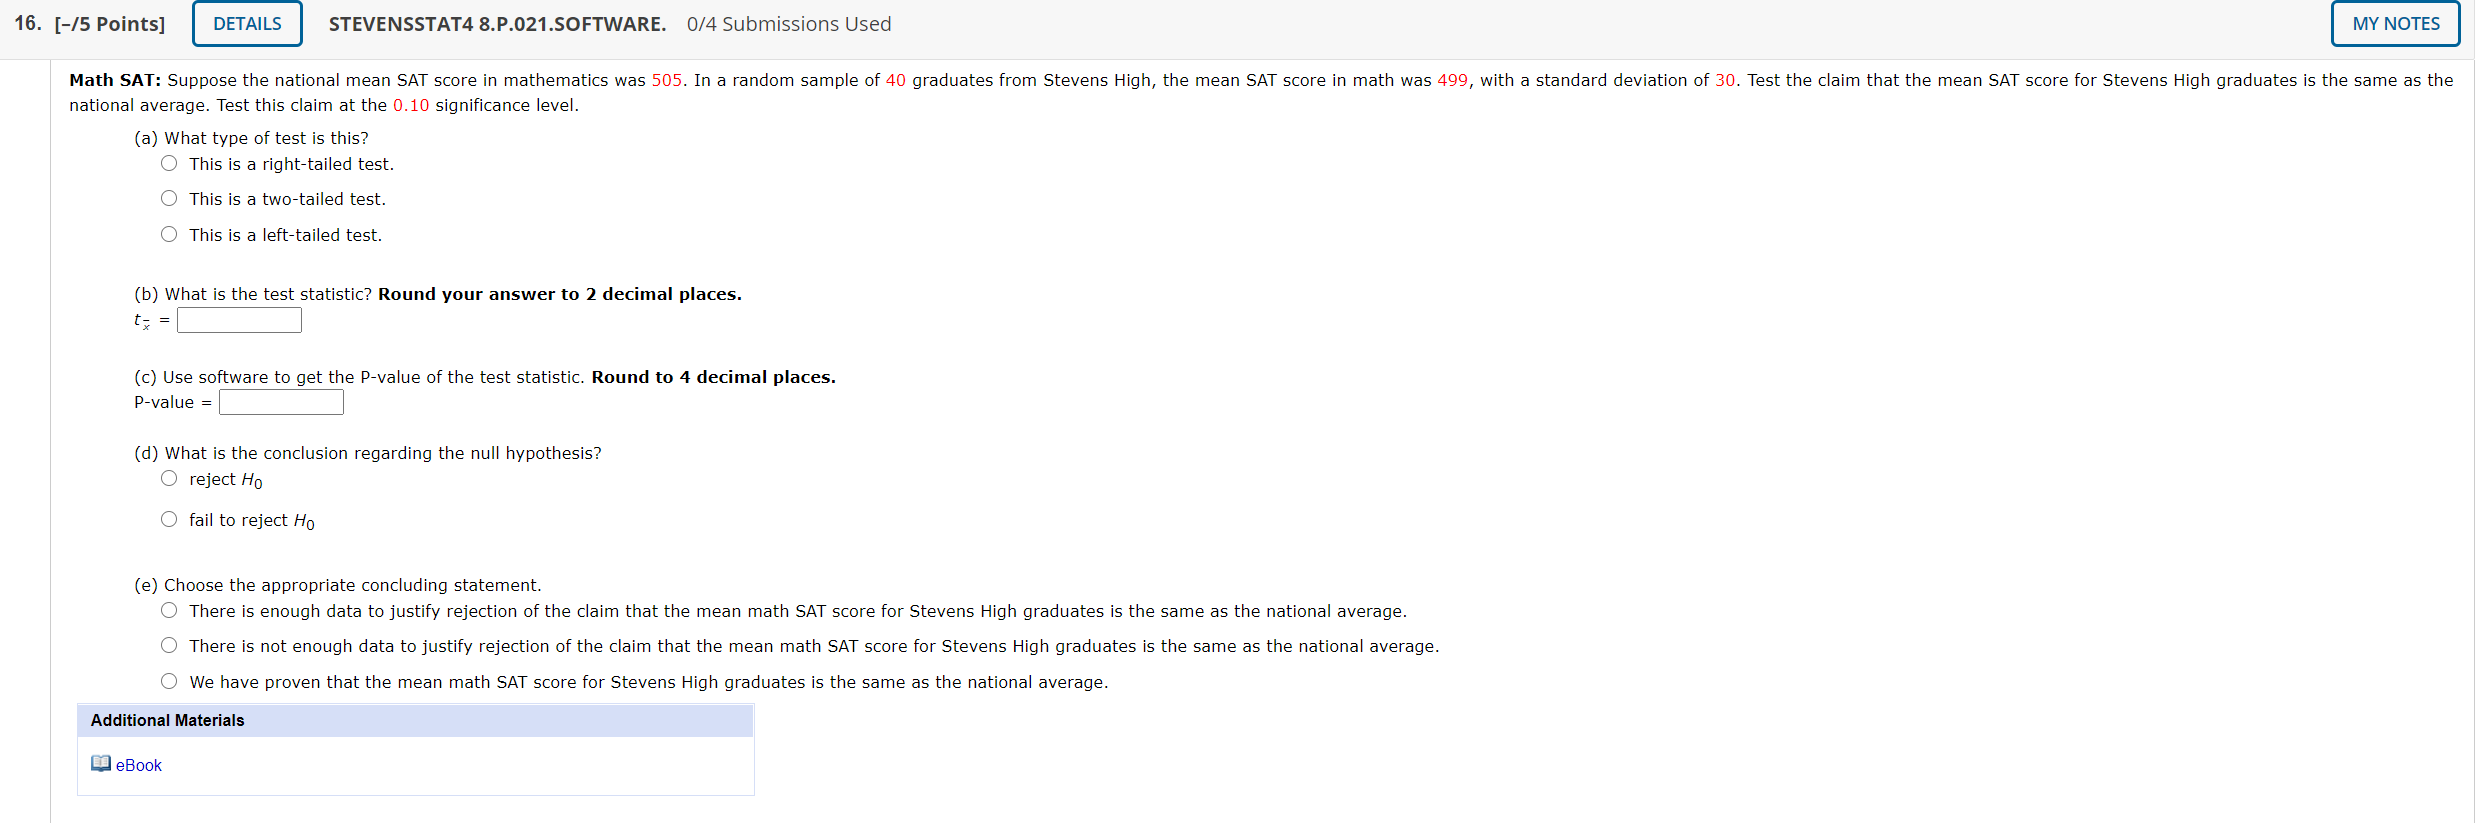
18. [-/5 Points] DETAILS STEVENSSTAT4 8.P.022.SOFTWARE. 0/4 Submissions Used MY NOTES Real Fruit Juice: A 32 ounce can of a popular fruit drink claims to contain 20% real fruit juice. Since this is a 32 ounce can, they are actually claiming that the can contains 6.4 ounces of real fruit juice. The consumer protection agency samples 52 such cans of this fruit drink. Of these, the mean volume of fruit juice is 6.32 with standard deviation of 0.25. Test the claim that the mean amount of real fruit juice in all 32 ounce cans is 6.4 ounces. Test this claim at the 0.01 significance level. (a) What type of test is this? O This is a two-tailed test. This is a left-tailed test. O This is a right-tailed test. (b) What is the test statistic? Round your answer to 2 decimal places. to = (c) Use software to get the P-value of the test statistic. Round to 4 decimal places. P-value = (d) What is the conclusion regarding the null hypothesis? O reject Ho O fail to reject Ho (e) Choose the appropriate concluding statement. There is enough data to justify rejection of the claim that the mean amount of real fruit juice in all 32 ounce cans is 6.4 ounces. There is not enough data to justify rejection of the claim that the mean amount of real fruit juice in all 32 ounce cans is 6.4 ounces. We have proven that the mean amount of real fruit juice in all 32 ounce cans is 6.4 ounces. We have proven that the mean amount of real fruit juice in all 32 ounce cans is not 6.4 ounces.17. [-/5 Points] DETAILS STEVENSSTAT4 8.P.022.DATA. 0/4 Submissions Used MY NOTES Real Fruit Juice (Raw Data, Software Required): A 32 ounce can of a popular fruit drink claims to contain 20% real fruit juice. Since this is a 32 ounce can, they are actually claiming that the can contains 6.4 ounces of real fruit juice. The consumer protection agency samples 30 such cans of this fruit drink. The amount of real fruit juice i each can is given in the table below. Test the claim that the mean amount of real fruit juice in all 32 ounce cans is 6.4 ounces. Test this claim at the 0.01 significance level. (a) What type of test is this? DATA ( n = 30 ) O This is a right-tailed test. Real Juice O This is a left-tailed test. ounces 6.30 This is a two-tailed test. 6.53 6.54 (b) What is the test statistic? Round your answer to 2 decimal places. 6.37 6.25 6.00 (c) Use software to get the P-value of the test statistic. Round to 4 decimal places. 6.27 P-value = 6.04 6.09 (d) What is the conclusion regarding the null hypothesis? 6.03 O reject Ho 6.49 O fail to reject Ho 6.00 6.49 5.99 (e) Choose the appropriate concluding statement. 6.63 There is enough data to justify rejection of the claim that the mean amount of real fruit juice in all 32 ounce cans is 6.4 ounces. 6.32 6.52 O There is not enough data to justify rejection of the claim that the mean amount of real fruit juice in all 32 ounce cans is 6.4 ounces. 6.44 We have proven that the mean amount of real fruit juice in all 32 ounce cans is 6.4 ounces. 5.95 We have proven that the mean amount of real fruit juice in all 32 ounce cans is not 6.4 ounces. 6.10 6.21 6.25 5.78 6.57 5.70 6.69 6.44 6.74 6.30 6.24 Additional Materials16. [-/5 Points] DETAILS STEVENSSTAT4 8.P.021.SOFTWARE. 0/4 Submissions Used MY NOTES Math SAT: Suppose the national mean SAT score in mathematics was 505. In a random sample of 40 graduates from Stevens High, the mean SAT score in math was 499, with a standard deviation of 30. Test the claim that the mean SAT score for Stevens High graduates is the same as the national average. Test this claim at the 0.10 significance level. (a) What type of test is this? O This is a right-tailed test. O This is a two-tailed test. O This is a left-tailed test. (b) What is the test statistic? Round your answer to 2 decimal places. x = (c) Use software to get the P-value of the test statistic. Round to 4 decimal places. P-value = (d) What is the conclusion regarding the null hypothesis? O reject Ho O fail to reject Ho (e) Choose the appropriate concluding statement. O There is enough data to justify rejection of the claim that the mean math SAT score for Stevens High graduates is the same as the national average. O There is not enough data to justify rejection of the claim that the mean math SAT score for Stevens High graduates is the same as the national average. We have proven that the mean math SAT score for Stevens High graduates is the same as the national average. Additional Materials eBook