?????????????????????????????
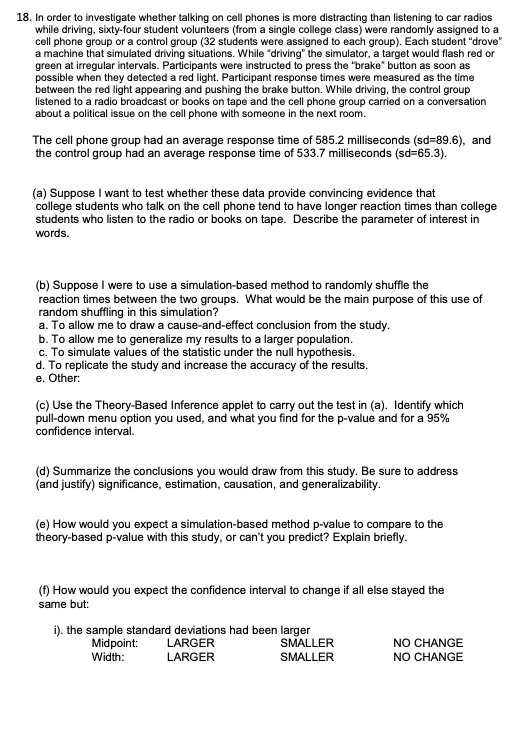
18. In order to investigate whether talking on cell phones is more distracting than listening to car radios while driving, sixty-four student volunteers (from a single college class) were randomly assigned to a cell phone group or a control group (32 students were assigned to each group). Each student "drove" a machine that simulated driving situations. While "driving" the simulator, a target would flash red or green at irregular intervals. Participants were instructed to press the "brake" button as soon as possible when they detected a red light. Participant response times were measured as the time between the red light appearing and pushing the brake button. While driving, the control group listened to a radio broadcast or books on tape and the cell phone group carried on a conversation about a political issue on the cell phone with someone in the next room. The cell phone group had an average response time of 585.2 milliseconds (sd=89.6), and the control group had an average response time of 533.7 milliseconds (sd=65.3) (a) Suppose I want to test whether these data provide convincing evidence that college students who talk on the cell phone tend to have longer reaction times than college students who listen to the radio or books on tape. Describe the parameter of interest in words. (b) Suppose I were to use a simulation-based method to randomly shuffle the reaction times between the two groups. What would be the main purpose of this use of random shuffling in this simulation? a. To allow me to draw a cause-and-effect conclusion from the study. b. To allow me to generalize my results to a larger population. c. To simulate values of the statistic under the null hypothesis. d. To replicate the study and increase the accuracy of the results. e. Other: (c) Use the Theory-Based Inference applet to carry out the test in (a). Identify which pull-down menu option you used, and what you find for the p-value and for a 95% confidence interval. (d) Summarize the conclusions you would draw from this study. Be sure to address (and justify) significance, estimation, causation, and generalizability. (e) How would you expect a simulation-based method p-value to compare to the theory-based p-value with this study, or can't you predict? Explain briefly. (f) How would you expect the confidence interval to change if all else stayed the same but: i). the sample standard deviations had been larger Midpoint: LARGER SMALLER NO CHANGE Width: LARGER SMALLER NO CHANGEii). the sample sizes had been larger Midpoint: LARGER SMALLER NO CHANGE Width: LARGER SMALLER NO CHANGE


