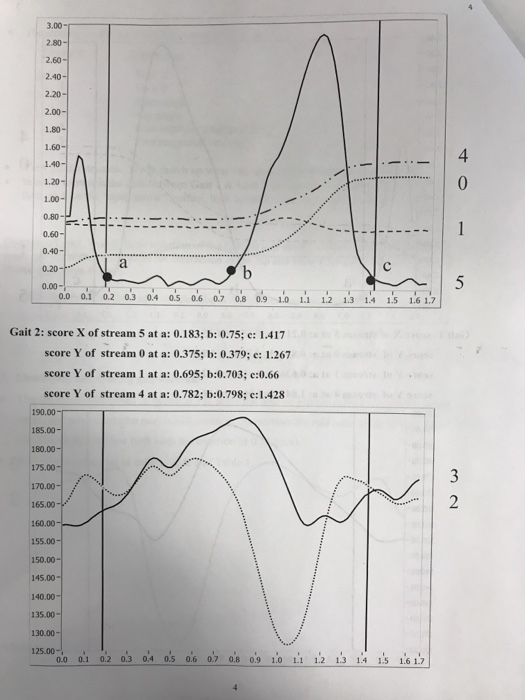
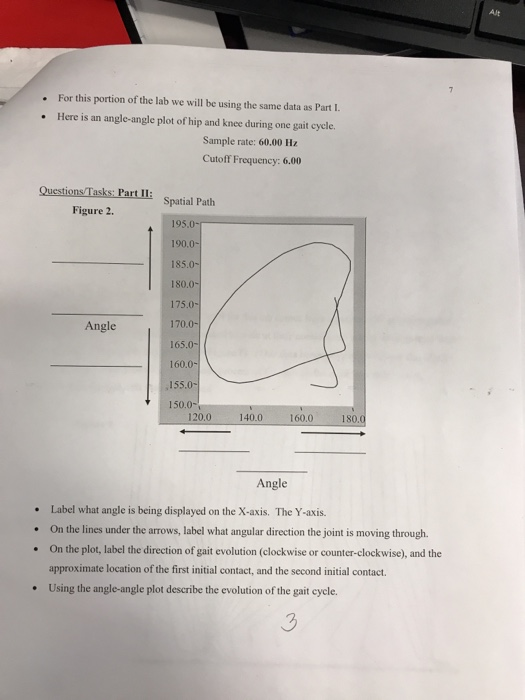
1.80- 1.60- 1.40- 1.20- 1.00- 0.80 0.60- 0.40- 0.20- a 0.00 - 20 o 02 03 04 as a's a os 09 10 11 12 13 14 15 16 17 Gait 2: score X of stream 5 at a: 0.183; b: 0.75; e: 1.417 score Y of stream 0 at a: 0.375; b: 0.379; e: 1.267 score Y of stream 1 at a: 0.695; b:0.703; e:0.66 score Y of stream 4 at a: 0.782; b:0.798; c:1.428 190.00 - 185.00 - 180.00 - 175.00 - 170.00- 165.00 - 160.00- 155.00 - 150.00 - 145.00- 140.00 - 135.00- 130.00 - 125.00- , , , , 00 01 02 03 04 05 06 07 08 09 10 11 12 13 14 15 16 17 . For this portion of the lab we will be using the same data as Part I Here is an angle-angle plot of hip and knee during one gait cycle. Sample rate: 60.00 HZ Cutoff Frequency: 6.00 Questions/Tasks: Part II: Figure 2. Spatial Path Angle 195.0-1 190.0- 185.0- 180.0- 175.0- 170.0- 165.0- 160.0- 155.0- 150.0- 120.0 140.0 160,0 180 Angle Label what angle is being displayed on the X-axis. The Y-axis. . On the lines under the arrows, label what angular direction the joint is moving through. . On the plot, label the direction of gait evolution (clockwise or counter-clockwise), and the approximate location of the first initial contact, and the second initial contact. . Using the angle-angle plot describe the evolution of the gait cycle. 1.80- 1.60- 1.40- 1.20- 1.00- 0.80 0.60- 0.40- 0.20- a 0.00 - 20 o 02 03 04 as a's a os 09 10 11 12 13 14 15 16 17 Gait 2: score X of stream 5 at a: 0.183; b: 0.75; e: 1.417 score Y of stream 0 at a: 0.375; b: 0.379; e: 1.267 score Y of stream 1 at a: 0.695; b:0.703; e:0.66 score Y of stream 4 at a: 0.782; b:0.798; c:1.428 190.00 - 185.00 - 180.00 - 175.00 - 170.00- 165.00 - 160.00- 155.00 - 150.00 - 145.00- 140.00 - 135.00- 130.00 - 125.00- , , , , 00 01 02 03 04 05 06 07 08 09 10 11 12 13 14 15 16 17 . For this portion of the lab we will be using the same data as Part I Here is an angle-angle plot of hip and knee during one gait cycle. Sample rate: 60.00 HZ Cutoff Frequency: 6.00 Questions/Tasks: Part II: Figure 2. Spatial Path Angle 195.0-1 190.0- 185.0- 180.0- 175.0- 170.0- 165.0- 160.0- 155.0- 150.0- 120.0 140.0 160,0 180 Angle Label what angle is being displayed on the X-axis. The Y-axis. . On the lines under the arrows, label what angular direction the joint is moving through. . On the plot, label the direction of gait evolution (clockwise or counter-clockwise), and the approximate location of the first initial contact, and the second initial contact. . Using the angle-angle plot describe the evolution of the gait cycle


