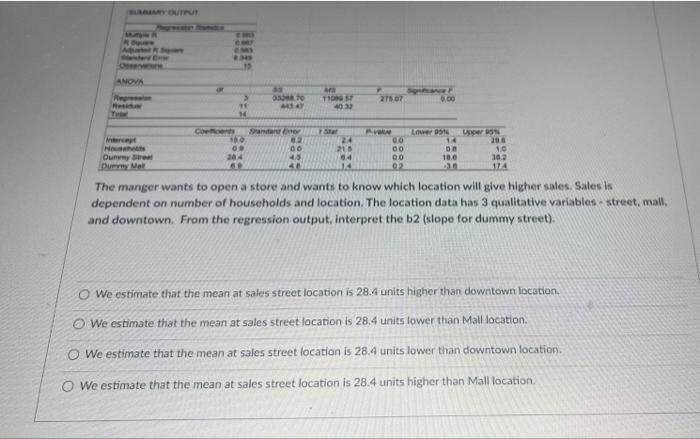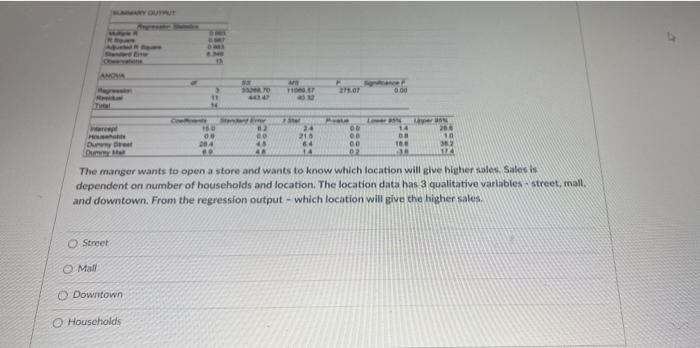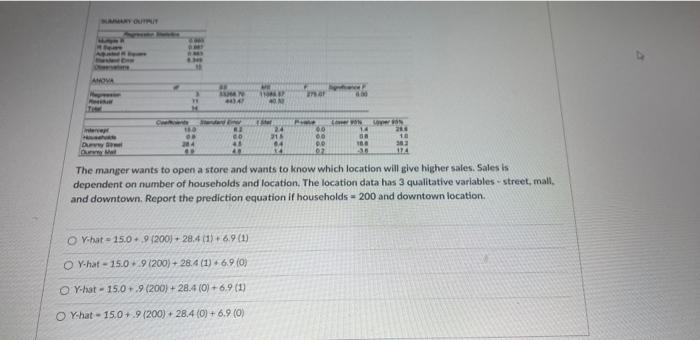


19 ANOVA T10 40 275 0.00 14 ch Santa Lower 10 PS 24 28 5.4 14 UN 200 10 10.0 302 174 Dunny Srl 48 GO 00 00 02 284 60 The manger wants to open a store and wants to know which location will give higher sales. Sales is dependent on number of households and location. The location data has 3 qualitative variables - street, mall, and downtown. From the regression output, interpret the b2 (slope for dummy street). We estimate that the mean at sales street location is 28.4 units higher than downtown location We estimate that the mean at sales street location is 28,4 units lower than Mall location We estimate that the mean at sales street location is 28.4 units lower than downtown locatiory. We estimate that the mean at sales street location is 28.4 units higher than Mall location . 000 2 28 10 00 24 21 8 14 14 08 10.0 OB 00 00 DY w 204 45 4 The manger wants to open a store and wants to know which location will give higher sales Sales dependent on number of households and location. The location data has 3 qualitative variablesstreet, mall, and downtown. From the regression output - which location will give the higher sales Street Mall Downtown O Households AMOR 10 00 14 24 711 64 EN 26 10 33 114 co at 4 DE 04 20 02 The manger wants to open a store and wants to know which location will give higher sales. Sales is dependent on number of households and location. The location data has 3 qualitative variables street, mall, and downtown. Report the prediction equation if households - 200 and downtown location. Yhat - 15.0.9200) + 28.401) + 6.9 (1) Y-hat-15.091200) + 28.4 (1) 69 (0) Y hat - 15.0+ 9 (200) + 28.4 (0) +6.9 (1) Y hat - 15.0+ 9 (200) 28.4 (0) + 6.9 (0) 19 ANOVA T10 40 275 0.00 14 ch Santa Lower 10 PS 24 28 5.4 14 UN 200 10 10.0 302 174 Dunny Srl 48 GO 00 00 02 284 60 The manger wants to open a store and wants to know which location will give higher sales. Sales is dependent on number of households and location. The location data has 3 qualitative variables - street, mall, and downtown. From the regression output, interpret the b2 (slope for dummy street). We estimate that the mean at sales street location is 28.4 units higher than downtown location We estimate that the mean at sales street location is 28,4 units lower than Mall location We estimate that the mean at sales street location is 28.4 units lower than downtown locatiory. We estimate that the mean at sales street location is 28.4 units higher than Mall location . 000 2 28 10 00 24 21 8 14 14 08 10.0 OB 00 00 DY w 204 45 4 The manger wants to open a store and wants to know which location will give higher sales Sales dependent on number of households and location. The location data has 3 qualitative variablesstreet, mall, and downtown. From the regression output - which location will give the higher sales Street Mall Downtown O Households AMOR 10 00 14 24 711 64 EN 26 10 33 114 co at 4 DE 04 20 02 The manger wants to open a store and wants to know which location will give higher sales. Sales is dependent on number of households and location. The location data has 3 qualitative variables street, mall, and downtown. Report the prediction equation if households - 200 and downtown location. Yhat - 15.0.9200) + 28.401) + 6.9 (1) Y-hat-15.091200) + 28.4 (1) 69 (0) Y hat - 15.0+ 9 (200) + 28.4 (0) +6.9 (1) Y hat - 15.0+ 9 (200) 28.4 (0) + 6.9 (0)


