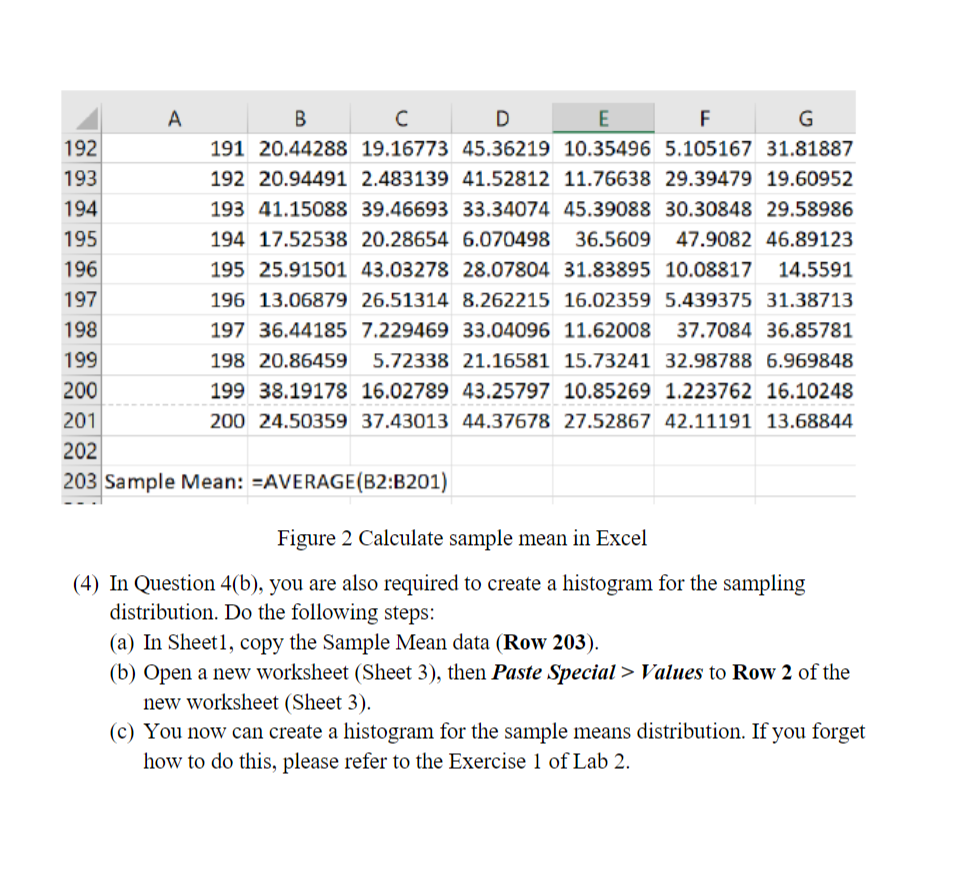
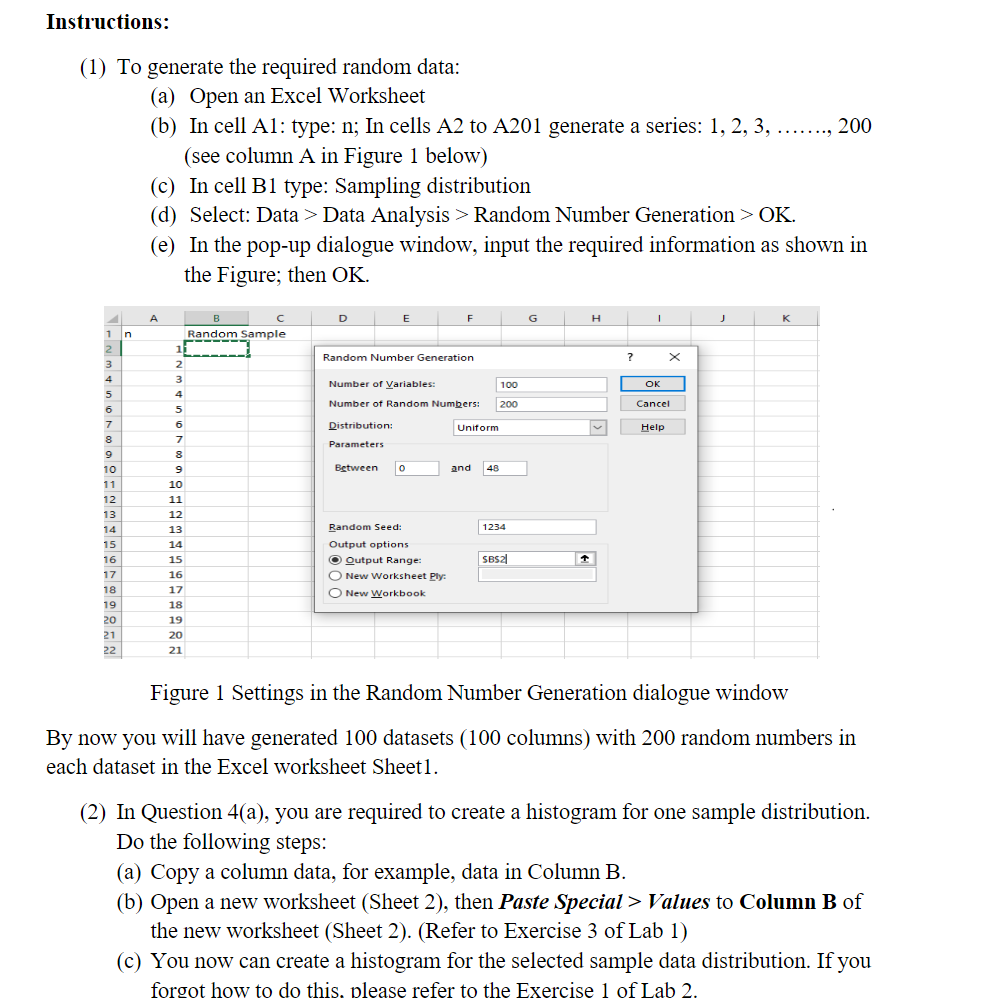
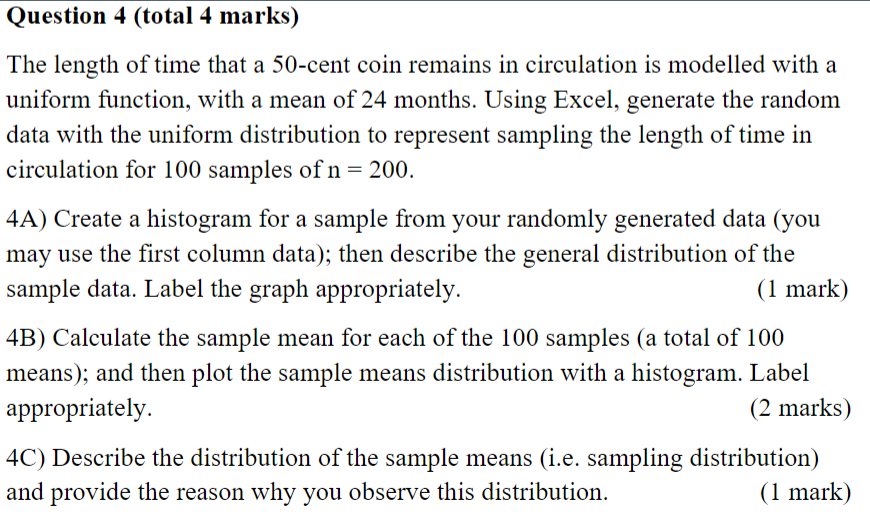
192 193 194 195 196 197 198 199 200 201 202 191 192 193 194 195 196 197 198 199 200 B 20.44288 20.94491 41.15088 17.52538 25.91501 13.06879 36.44185 20.86459 38.19178 24.50359 C 19.16773 2.483139 39.46693 20.28654 43.03278 26.51314 7.229469 5.72338 16.02789 37.43013 203 Sample Mean: =AVERAGEIBZ:8201) D 45.36219 41.52812 33.34074 6.070498 28.07804 8.262215 33.04096 21.16581 43.25797 44.37678 E 10.35496 11.76638 45.39088 36.5609 31.83895 16.02359 11.62008 15.73241 10.85269 27.52867 Figure 2 Calculate sample mean in Excel F 5.105167 29.39479 30.30848 47.9082 10.08317 5.439375 37.7084 32.98788 1.223762 42.11191 G 31.81887 19.60952 29.58986 46.89123 14.5591 31.38713 36.85781 6.969848 16.10248 13.68844 (4) In Question 403]. you are also required to create a histogram for the sampling distribution. Do the following steps: {a} In Sheetl. copy the Sample Mean data {Row 203 ). (b) Open a new worksheet (Sheet 3). then Paste Special > Values to Row 2 of the new worksheet {Sheet 3). {c} You now can create a histogram for the sample means distribution. If you forget how to do this. please refer to the Exercise 1 of Lab 2. Instructions: (1) To generate the required random data: (a) Open an Excel Worksheet (b) In cell Al: type: n; In cells A2 to A201 generate a series: 1, 2, 3, ......., 200 (see column A in Figure 1 below) (c) In cell Bl type: Sampling distribution (d) Select: Data > Data Analysis > Random Number Generation > OK. (e) In the pop-up dialogue window, input the required information as shown in the Figure; then OK. G H K Random Sample Random Number Generation Number of Variables: 100 OK Number of Random Numbers: 200 Cancel Distribution Uniform Help Parameters Between 0 and 48 Random Seed 1234 Output options O Output Range: SB$2 16 New Worksheet Ply: New Workbook Figure 1 Settings in the Random Number Generation dialogue window By now you will have generated 100 datasets (100 columns) with 200 random numbers in each dataset in the Excel worksheet Sheetl. (2) In Question 4(a), you are required to create a histogram for one sample distribution. Do the following steps: (a) Copy a column data, for example, data in Column B. (b) Open a new worksheet (Sheet 2), then Paste Special > Values to Column B of the new worksheet (Sheet 2). (Refer to Exercise 3 of Lab 1) (c) You now can create a histogram for the selected sample data distribution. If you forgot how to do this, please refer to the Exercise 1 of Lab 2.Question 4 (total 4 marks) The length of time that a SO-cent coin remains in circulation is modelled with a uniform function. with a mean of 24 months. Using Excel. generate the random data with the uniform distribution to represent sampling the length of time in circulation for 100 samples of n = 300. 4A) Create a histogram for a sample from your randomly generated data {you may use the rst column data); then describe the general distribution of the sample data. Label the graph appropriately. {1 mark) 4B) Calculate the sample mean for each ofthe 100 samples (a total of 100 means); and then plot the sample means distribution with a histogram. Label appropriately. (2 marks) 4C) Describe the distribution of the sample means (i.e. sampling distribution) and provide the reason why you observe this distribution. ( 1 mark) (3) In Question 4(b), you are required to find all the sample means of the 100 datasets. Do the following steps: (a) In your worksheet: Sheet1, click on cell A203, enter Sample Mean. (b) Click on cell B203, enter formula: = AVERAGE(B2:B201), as shown in Figure 2 below, to obtain the mean for the first sample. (c) Copy the formula of cell B203 to remaining 99 cells in row 203 to obtain all the sample means (a total of 100 sample means). Page 5 of 6 A B C D E F G 192 191 20.44288 19.16773 45.36219 10.35496 5.105167 31.81887 193 192 20.94491 2.483139 41.52812 11.76638 29.39479 19.60952 194 193 41.15088 39.46693 33.34074 45.39088 30.30848 29.58986 195 194 17.52538 20.28654 6.070498 36.5609 47.9082 46.89123 196 195 25.91501 43.03278 28.07804 31.83895 10.08817 14.5591 197 196 13.06879 26.51314 8.262215 16.02359 5.439375 31.38713 198 197 36.44185 7.229469 33.04096 11.62008 37.7084 36.85781 199 198 20.86459 5.72338 21.16581 15.73241 32.98788 6.969848
Step by Step Solution
There are 3 Steps involved in it
Step: 1
Get Instant Access to Expert-Tailored Solutions
See step-by-step solutions with expert insights and AI powered tools for academic success
Step: 2
Step: 3
Ace Your Homework with AI
Get the answers you need in no time with our AI-driven, step-by-step assistance