

Answered step by step
Verified Expert Solution
Question
1 Approved Answer
19.5 NASA HORIZONS EARTH TRAJECTORY MAIN.PY # write all your code here filename = EARTH_horizons_results.txt # populate 'positions' # plot In this problem you will
19.5 NASA HORIZONS EARTH TRAJECTORY
MAIN.PY
# write all your code here
filename = "EARTH_horizons_results.txt"
# populate 'positions'
# plot
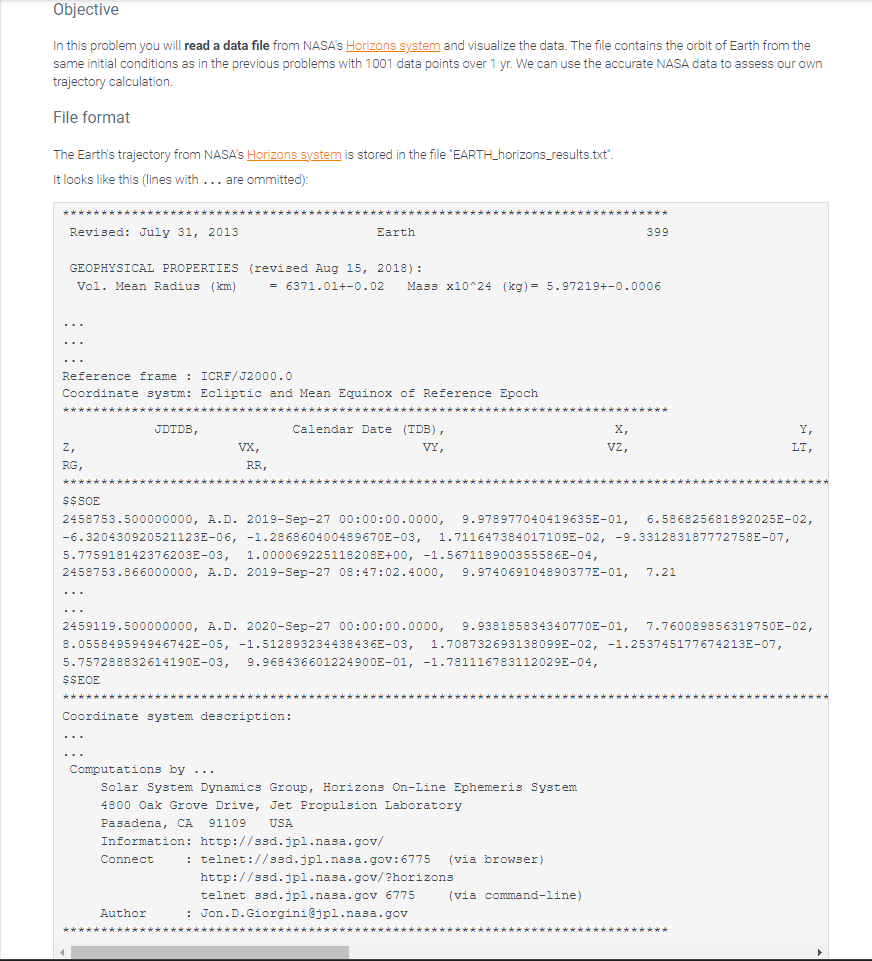
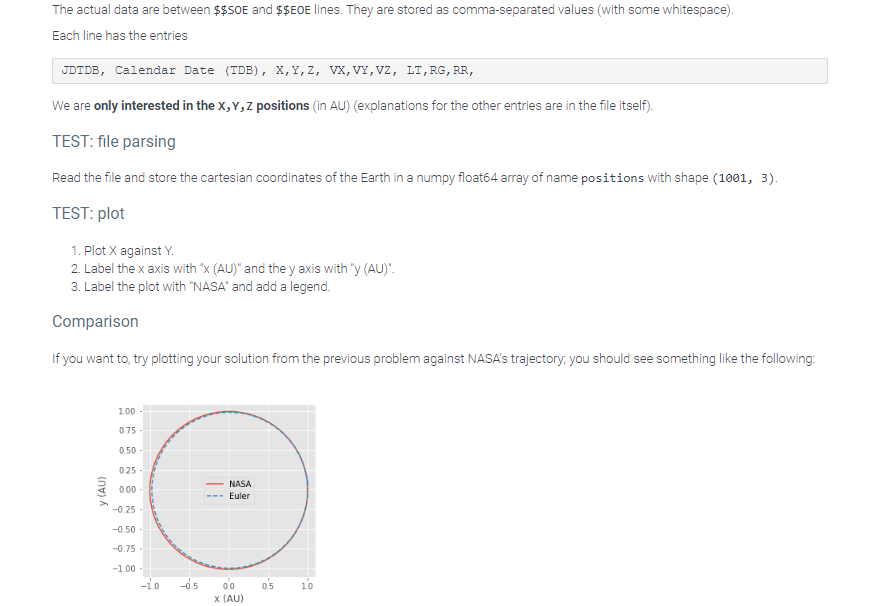
In this problem you will read a data file from NASA's Horizons system and visualize the data. The file contains the orbit of Earth from the same initial conditions as in the previous problems with 1001 data points over 1 yr. We can use the accurate NASA data to assess our own trajectory calculation. File format The Earth's trajectory from NASA's Horizons system is stored in the file "EARTH_horizons_results.txt". It looks like this (lines with ... are ommitted): Revised: July 31, 2013399 GEOPHYSICAL PROPERTIES (revised Aug 15, 2018): Vol. Mean Radius (km)=6371.01+0.02Massx1024(kg)=5.97219+0.0006 Reference frame : ICRF/J 2000.0 Coordinate systm: Ecliptic and Mean Equinox of Reference Epoch We are only interested in the X,Y,Z positions (in AU) (explanations for the other entries are in the file itself). TEST: file parsing Read the file and store the cartesian coordinates of the Earth in a numpy float64 array of name positions with shape (1001, 3 ). TEST: plot 1. Plot X against Y. 2. Label the x axis with " x(AU) " and the y axis with " y(AU) ". 3. Label the plot with "NASA" and add a legendStep by Step Solution
There are 3 Steps involved in it
Step: 1

Get Instant Access to Expert-Tailored Solutions
See step-by-step solutions with expert insights and AI powered tools for academic success
Step: 2

Step: 3
Ace Your Homework with AI
Get the answers you need in no time with our AI-driven, step-by-step assistance
Get Started
Optimizing Database Performance Techniques To Optimize The Efficiency Of Database Systems And Applications
Authors: Craig S Mullins
1st Edition
B0CFZFD49Y, 979-8857641286