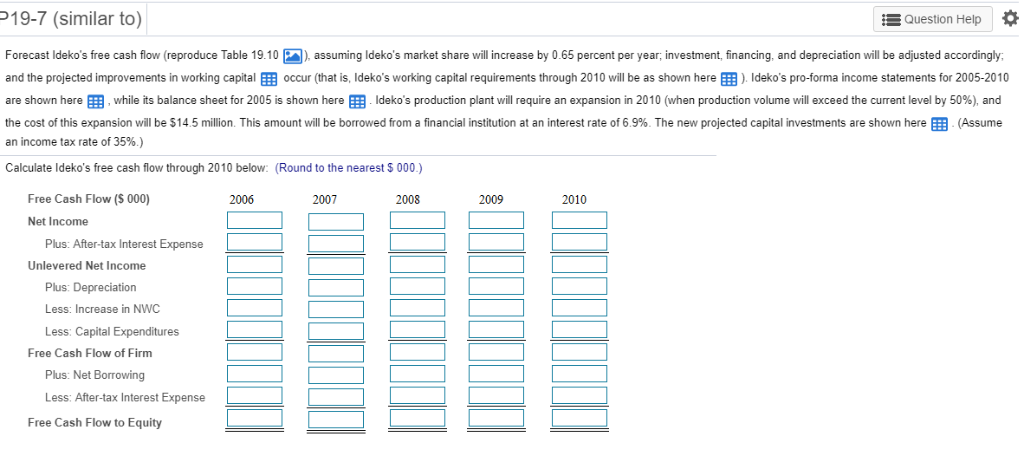
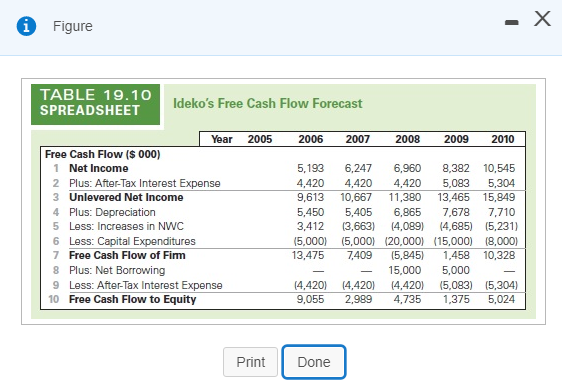
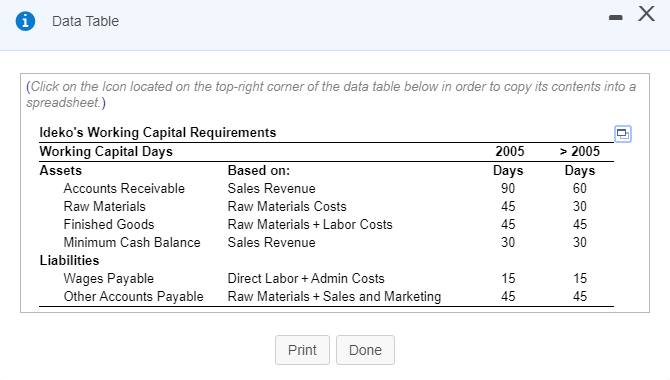
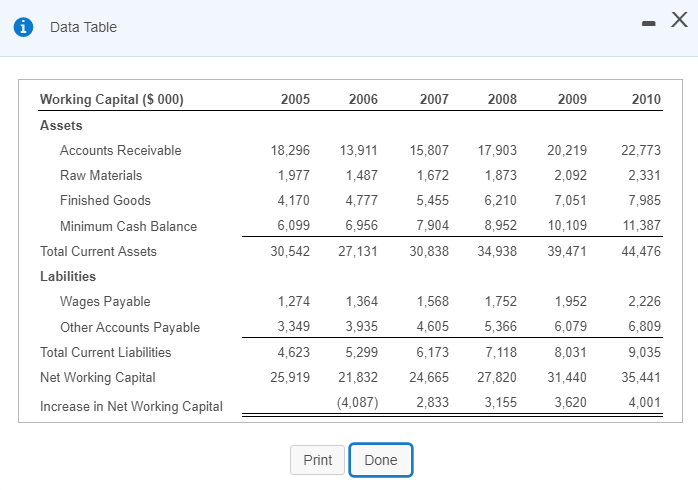
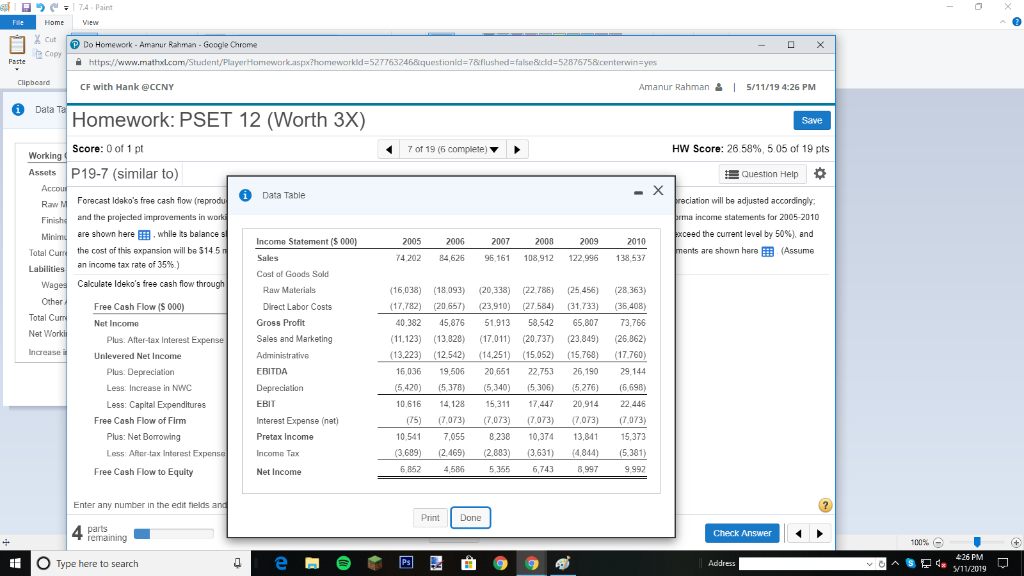
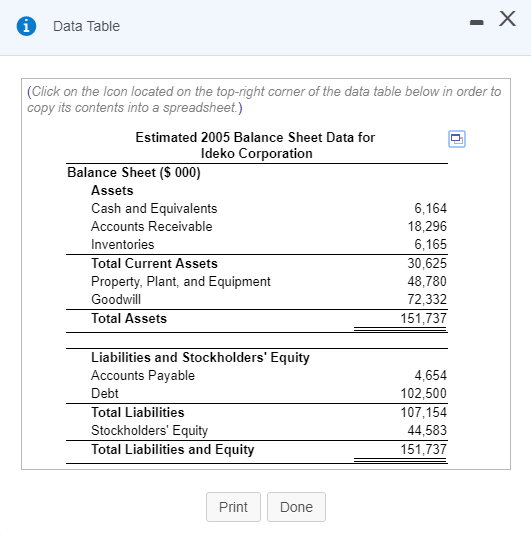
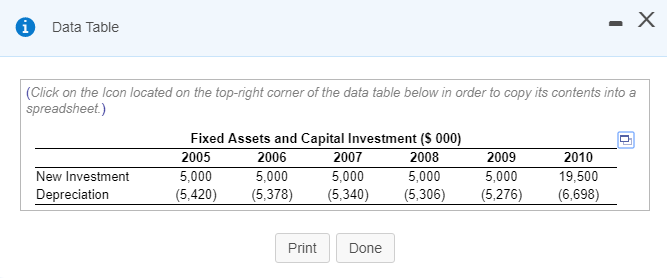
19-7 (similar to) Question Help Forecast Ideko's free cash flow (reproduce Table 19.10assuming Ideko's market share will increase by 0.65 percent per year, investment, financing, and depreciation will be adjusted accordingly and the projected improvements in working capital EBoccur (that is, Ideko's working capital requirements through 2010 will be as shown here B). Ideko's pro-forma income statements for 2005-2010 are shown here EE, while its balance sheet for 2005 is shown here Ideko's production plant will require an expansion in 2010 (when production volume will exceed the current level by 50%), and the cost of this expansion will be $14 5 million. This amount will be borrowed from a financial institution at an interest rate of 6.9% The new projected capital investments are shown here Assume an income tax rate of 35% ) Calculate Ideko's free cash flow through 2010 below: (Round to the nearest $ 000 Free Cash Flow (S 000) 2006 2007 2008 2009 2010 Net Income Plus: After-tax Interest Expense Unlevered Net Income Plus: Depreciation Less: Increase in NWC Less: Capital Expenditures Free Cash Flow of Firm Plus: Net Borrowing Less: After-tax Interest Expense Free Cash Flow to Equity Figure TABLE 19.10 SPREADSHEET 5 Ideko's Free Cash Flow Forecast Year 2005 2 2006 2007 2008 2009 2010 Free Cash Flow ($ 000) 1 Net Income 2 Plus: After-Tax Interest Expense 3 Unlevered Net Income 4 Plus: Depreciation 5 Less: Increases in NWC 6 Less: Capital Expenditures 7 Free Cash Flow of Firm 8 Plus: Net Borrowing 9 Less: After-Tax Interest Expense 5,193 6,247 6,960 8,382 10,545 4,420 4,420 4,420 5,083 5,304 9,613 10,667 11,380 13,465 15,849 5,450 5,405 6,865 7,678 7,710 3,412 3,663 4,089) 4,685) (5,231) 5,000 5,000 (20,000) 15,000) (8,000 13,475 7409 (5,845 1,458 10,328 15,000 5,000 4,420 4,420 4,420) 5,083) 5,304 9,055 2,989 4,735 1,375 5,024 10 Free Cash Flow to Equity Print Done Data Table 2010 Working Capital ($ 000) 2005 2006 2007 2008 2009 Assets Accounts Receivable Raw Materials Finished Goods Minimum Cash Balance 18,296 13,91115,807 17,903 20,21922,773 2,331 7,985 11,387 30,542 27,131 30,838 34,93839,471 44,476 2,092 4,1704,7775,455 6,210 7,051 8.952 10,109 ,9771,487 1,672 1,873 6,099 7,904 6,956 Total Current Assets Labilities 2,226 6,809 9,035 25,919 21,832 24,665 27,820 31,440 35,441 4,001 Wages Payable 1,2741,364 1,568 1,752 1,952 6,079 8,031 3,349 4,605 5,366 3,935 Other Accounts Payable Total Current Liabilities Net Working Capital Increase in Net Working Capital 4,623 5,299 6,1737,118 4,087) 2,8333,155 3,620 Print Done C" | 74 , paint Cut Do Homework- Amanur Rahman Google Chrome https CF with Hank @cCNY Copy x?homeworkld-5277632468iquestionld-7&flushed-false&ld-52876758centerwin-yes anur Rahman 1 5/11/19 4:26 PM Am Homework: PSET 12 (Worth 3X) Score: 0 of 1 pt HW Score: 26 58%, 5 05 of 19 pts 7 of 19 (6 complete) Working Assets P19-7 (similar to) Question Help Data Table ciation will be adjusted accordingly RawM Forecast Idako's free cash flow and the projectled improvements in w are shown here.whlle lts balance the cost of this expansion will be $145 an income tax rate of 35%) a income statements for 2005-2010 ceed the current level by 50%), and are shown here (Assume Income Statement ($ 000 2005 2006 2007 2000 2009 2010 Total 4,202 84,626 96,161 108,912 122,996 138,537 Cost of Goods Sold Calculate Ideko's free cash flow through Raw Materials 16,038) 18093 (20,338) 22785) (25,456) (28,363) 7,782) (20,65 (23,910) (27584) 31,733) (36 408) 40,382 45,876 51913 58,542 65,807 73,766 11,123)(13,828 0 20737 (23,849) (26,862) (13,223) 12542) 4,25 505 5,76 17760) Other Total C Net Free Cash Flow ($ 000) Direct Labor Costs Gross Profit Sales and Marketing Administrative EBITDA Depreciation EBIT Interest Expense (net) Pretax Income Income Tax Net Income Net Income Plus. After-tax Interest Expense Unlevered Net Income Plus: Depreciation Less: Increase in NWC Less: Capital Expenditures 16,036 19,50620651 22,753 26,190 5,420) 5,378) 5,340) 5,306) 5,276) (6,698) 0,61614,128 15,311 17447 20,91422,446 75) (073) (073) ,073) ,073) (7073) 0,5417055 823 10,374 13,841 15,373 (3,631) (4,844) (5,381) Free Cash Flow of Firm Plus: Net Borowing 3,609) 2.469) 2 Less: ARer-tax Interest 6 852 5.355 6,743 8,997 9.992 4,586 Free Cash Flow to Equity Enter any number in the edit fields Print Done parts Check Answer 100% 426 PM O Type here to search Data Table (Click on the Icon located on the top-right corner of the data table below in order to copy its contents into a spreadsheet) Estimated 2005 Balance Sheet Data for Ideko Corporation Balance Sheet (S 000) Assets Cash and Equivalents Accounts Receivable Inventories Total Current Assets Property, Plant, and Equipment Goodwill Total Assets 6,164 18,296 6,165 30,625 48,780 72,332 151,737 Liabilities and Stockholders' Equity Accounts Payable Debt Total Liabilities Stockholders' Equity Total Liabilities and Equity 4,654 102,500 107,154 44,583 151,737 PrintDone -X i Data Table Click on the Icon located on the top-right corner of the data table below in order to copy its contents into a spreadsheet) Fixed Assets and Capital Investment (S 000) 2005 5,000 (5,420) 5,378) (5,340) 5,306) 5,276)(6,698) 2009 2010 2006 5,000 2007 5,000 2008 5,000 New Investment ,00019,500 Depreciation Print Done 19-7 (similar to) Question Help Forecast Ideko's free cash flow (reproduce Table 19.10assuming Ideko's market share will increase by 0.65 percent per year, investment, financing, and depreciation will be adjusted accordingly and the projected improvements in working capital EBoccur (that is, Ideko's working capital requirements through 2010 will be as shown here B). Ideko's pro-forma income statements for 2005-2010 are shown here EE, while its balance sheet for 2005 is shown here Ideko's production plant will require an expansion in 2010 (when production volume will exceed the current level by 50%), and the cost of this expansion will be $14 5 million. This amount will be borrowed from a financial institution at an interest rate of 6.9% The new projected capital investments are shown here Assume an income tax rate of 35% ) Calculate Ideko's free cash flow through 2010 below: (Round to the nearest $ 000 Free Cash Flow (S 000) 2006 2007 2008 2009 2010 Net Income Plus: After-tax Interest Expense Unlevered Net Income Plus: Depreciation Less: Increase in NWC Less: Capital Expenditures Free Cash Flow of Firm Plus: Net Borrowing Less: After-tax Interest Expense Free Cash Flow to Equity Figure TABLE 19.10 SPREADSHEET 5 Ideko's Free Cash Flow Forecast Year 2005 2 2006 2007 2008 2009 2010 Free Cash Flow ($ 000) 1 Net Income 2 Plus: After-Tax Interest Expense 3 Unlevered Net Income 4 Plus: Depreciation 5 Less: Increases in NWC 6 Less: Capital Expenditures 7 Free Cash Flow of Firm 8 Plus: Net Borrowing 9 Less: After-Tax Interest Expense 5,193 6,247 6,960 8,382 10,545 4,420 4,420 4,420 5,083 5,304 9,613 10,667 11,380 13,465 15,849 5,450 5,405 6,865 7,678 7,710 3,412 3,663 4,089) 4,685) (5,231) 5,000 5,000 (20,000) 15,000) (8,000 13,475 7409 (5,845 1,458 10,328 15,000 5,000 4,420 4,420 4,420) 5,083) 5,304 9,055 2,989 4,735 1,375 5,024 10 Free Cash Flow to Equity Print Done Data Table 2010 Working Capital ($ 000) 2005 2006 2007 2008 2009 Assets Accounts Receivable Raw Materials Finished Goods Minimum Cash Balance 18,296 13,91115,807 17,903 20,21922,773 2,331 7,985 11,387 30,542 27,131 30,838 34,93839,471 44,476 2,092 4,1704,7775,455 6,210 7,051 8.952 10,109 ,9771,487 1,672 1,873 6,099 7,904 6,956 Total Current Assets Labilities 2,226 6,809 9,035 25,919 21,832 24,665 27,820 31,440 35,441 4,001 Wages Payable 1,2741,364 1,568 1,752 1,952 6,079 8,031 3,349 4,605 5,366 3,935 Other Accounts Payable Total Current Liabilities Net Working Capital Increase in Net Working Capital 4,623 5,299 6,1737,118 4,087) 2,8333,155 3,620 Print Done C" | 74 , paint Cut Do Homework- Amanur Rahman Google Chrome https CF with Hank @cCNY Copy x?homeworkld-5277632468iquestionld-7&flushed-false&ld-52876758centerwin-yes anur Rahman 1 5/11/19 4:26 PM Am Homework: PSET 12 (Worth 3X) Score: 0 of 1 pt HW Score: 26 58%, 5 05 of 19 pts 7 of 19 (6 complete) Working Assets P19-7 (similar to) Question Help Data Table ciation will be adjusted accordingly RawM Forecast Idako's free cash flow and the projectled improvements in w are shown here.whlle lts balance the cost of this expansion will be $145 an income tax rate of 35%) a income statements for 2005-2010 ceed the current level by 50%), and are shown here (Assume Income Statement ($ 000 2005 2006 2007 2000 2009 2010 Total 4,202 84,626 96,161 108,912 122,996 138,537 Cost of Goods Sold Calculate Ideko's free cash flow through Raw Materials 16,038) 18093 (20,338) 22785) (25,456) (28,363) 7,782) (20,65 (23,910) (27584) 31,733) (36 408) 40,382 45,876 51913 58,542 65,807 73,766 11,123)(13,828 0 20737 (23,849) (26,862) (13,223) 12542) 4,25 505 5,76 17760) Other Total C Net Free Cash Flow ($ 000) Direct Labor Costs Gross Profit Sales and Marketing Administrative EBITDA Depreciation EBIT Interest Expense (net) Pretax Income Income Tax Net Income Net Income Plus. After-tax Interest Expense Unlevered Net Income Plus: Depreciation Less: Increase in NWC Less: Capital Expenditures 16,036 19,50620651 22,753 26,190 5,420) 5,378) 5,340) 5,306) 5,276) (6,698) 0,61614,128 15,311 17447 20,91422,446 75) (073) (073) ,073) ,073) (7073) 0,5417055 823 10,374 13,841 15,373 (3,631) (4,844) (5,381) Free Cash Flow of Firm Plus: Net Borowing 3,609) 2.469) 2 Less: ARer-tax Interest 6 852 5.355 6,743 8,997 9.992 4,586 Free Cash Flow to Equity Enter any number in the edit fields Print Done parts Check Answer 100% 426 PM O Type here to search Data Table (Click on the Icon located on the top-right corner of the data table below in order to copy its contents into a spreadsheet) Estimated 2005 Balance Sheet Data for Ideko Corporation Balance Sheet (S 000) Assets Cash and Equivalents Accounts Receivable Inventories Total Current Assets Property, Plant, and Equipment Goodwill Total Assets 6,164 18,296 6,165 30,625 48,780 72,332 151,737 Liabilities and Stockholders' Equity Accounts Payable Debt Total Liabilities Stockholders' Equity Total Liabilities and Equity 4,654 102,500 107,154 44,583 151,737 PrintDone -X i Data Table Click on the Icon located on the top-right corner of the data table below in order to copy its contents into a spreadsheet) Fixed Assets and Capital Investment (S 000) 2005 5,000 (5,420) 5,378) (5,340) 5,306) 5,276)(6,698) 2009 2010 2006 5,000 2007 5,000 2008 5,000 New Investment ,00019,500 Depreciation Print Done


