

Question
1a. How much cash did COBALT pay to suppliers in 2017? $_________ million 1b. How much dividend did COBART pay to shareholders in 2017? (Assume
1a. How much cash did COBALT pay to suppliers in 2017?
$_________ million
1b. How much dividend did COBART pay to shareholders in 2017? (Assume the dividend is paid in cash to shareholders in 2017.)
$_________ million
1c. Assuming that all Accrued expenses are related to operating activities: What is the COBALT's 2017 Cash Flow from operating activities? (If it is an outflow, add minus sign in to answer).
$_________ million
1d. Assuming Long-term investment is investing activities: What is the COBALT's 2017 Cash Flow from investing activities? (If it is an outflow, add minus sign to answer).
$_________ million
1e. What is the COBALT's 2017 Cash Flow from financing activities?
(If it is an outflow, add minus sign to answer).
$_________ million
1f. Addition of cash flow from operating activities, cash flow from investing activities and cash flow from financing activities of COBALT in 2017 should be:
$_________ million
Please answer only if you are absolutely certain of your work. You wll get Thumbs Up. Thank you!
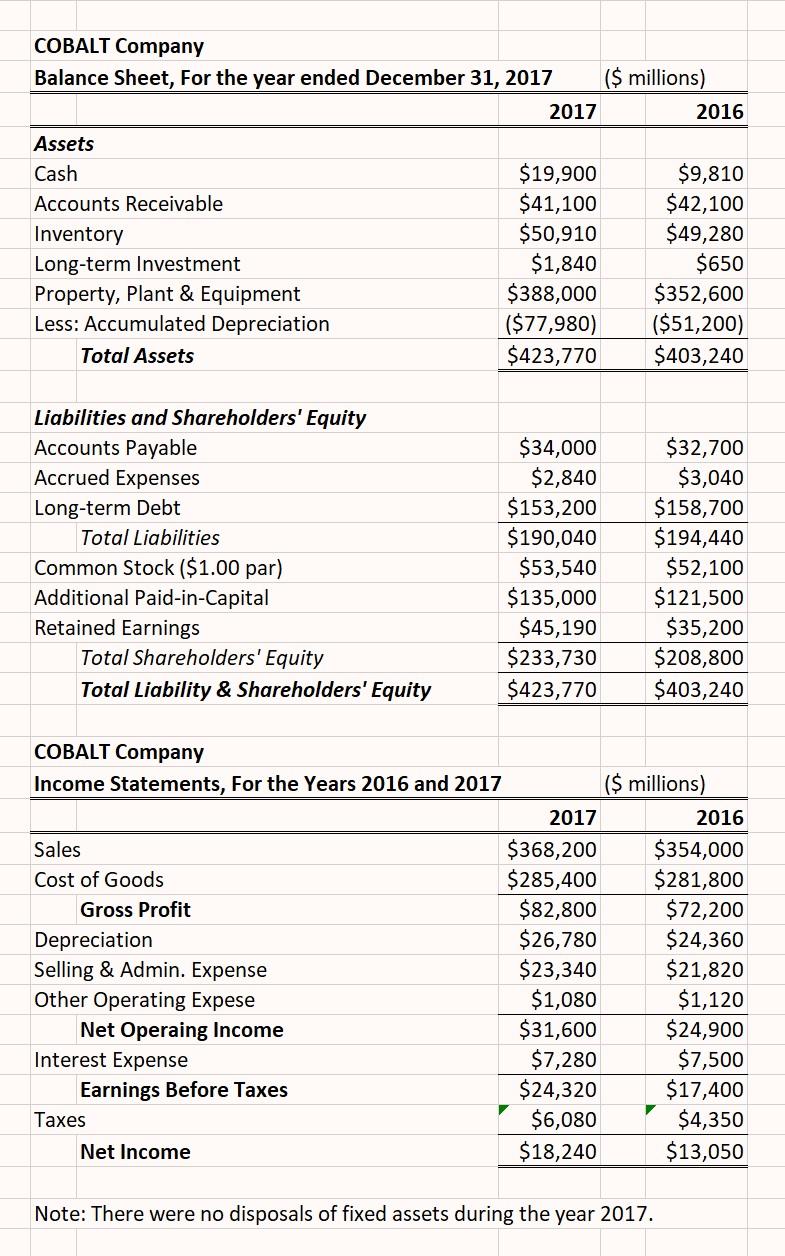
COBALT Company Balance Sheet, For the year ended December 31, 2017 ($ millions) 2017 2016 Assets Cash Accounts Receivable Inventory Long-term Investment Property, Plant & Equipment Less: Accumulated Depreciation Total Assets $19,900 $41,100 $50,910 $1,840 $388,000 ($77,980) $423,770 $9,810 $42,100 $49,280 $650 $352,600 ($51,200) $403,240 Liabilities and Shareholders' Equity Accounts Payable Accrued Expenses Long-term Debt Total Liabilities Common Stock ($1.00 par) Additional Paid-in-Capital Retained Earnings Total Shareholders' Equity Total Liability & Shareholders' Equity $34,000 $2,840 $153,200 $190,040 $53,540 $135,000 $45,190 $233,730 $423,770 $32,700 $3,040 $158,700 $194,440 $52,100 $121,500 $35,200 $208,800 $403,240 COBALT Company Income Statements, For the Years 2016 and 2017 ($ millions) 2017 2016 Sales $368,200 $354,000 Cost of Goods $285,400 $281,800 Gross Profit $82,800 $72,200 Depreciation $26,780 $24,360 Selling & Admin. Expense $23,340 $21,820 Other Operating Expese $1,080 $1,120 Net Operaing Income $31,600 $24,900 Interest Expense $7,280 $7,500 Earnings Before Taxes $24,320 $17,400 Taxes $6,080 $4,350 Net Income $18,240 $13,050 Note: There were no disposals of fixed assets during the year 2017Step by Step Solution
There are 3 Steps involved in it
Step: 1

Get Instant Access to Expert-Tailored Solutions
See step-by-step solutions with expert insights and AI powered tools for academic success
Step: 2

Step: 3
Ace Your Homework with AI
Get the answers you need in no time with our AI-driven, step-by-step assistance
Get Started
The No Nonsense Guide To Globalization
Authors: Wayne Ellwood
1st Edition
1904456448, 190652355X, 9781906523558