

Question
1.a. produce a Scatter Plot using the total population for each of the years from the Probability Island.The horizontal axis should always represent time. b.
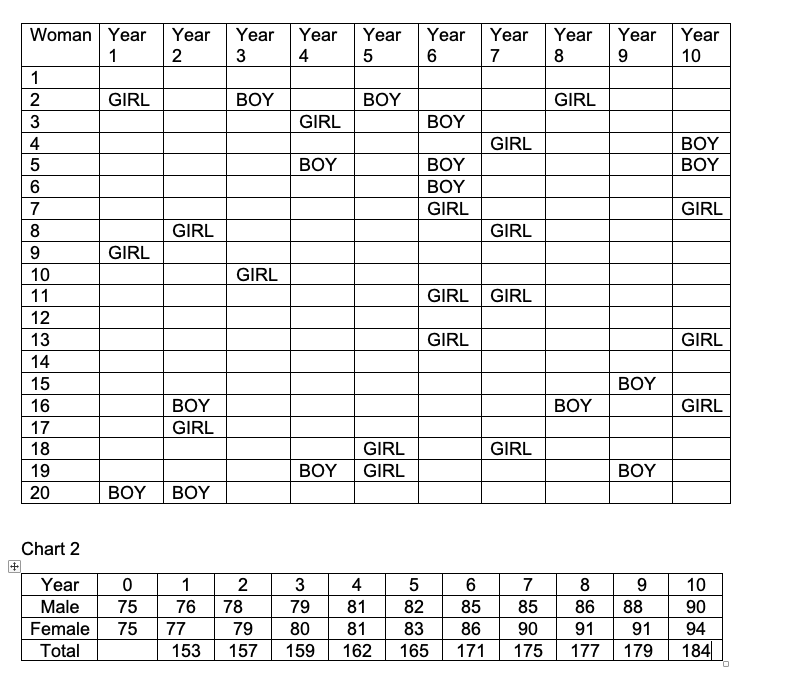
1.a. produce a Scatter Plot using the total population for each of the years from the Probability Island.The horizontal axis should always represent time.
b. Use linear regression or a trendline in Excel to find the equation of the best fit line.
c. Find the Correlation Coefficient.Explain what this means for your data.
d. Use the equation to predict the population in year 20.
Step by Step Solution
There are 3 Steps involved in it
Step: 1

Get Instant Access to Expert-Tailored Solutions
See step-by-step solutions with expert insights and AI powered tools for academic success
Step: 2

Step: 3
Ace Your Homework with AI
Get the answers you need in no time with our AI-driven, step-by-step assistance
Get Started
Applied Calculus
Authors: Stefan Waner, Steven Costenoble
7th Edition
1337514306, 9781337514309