

Answered step by step
Verified Expert Solution
Question
1 Approved Answer
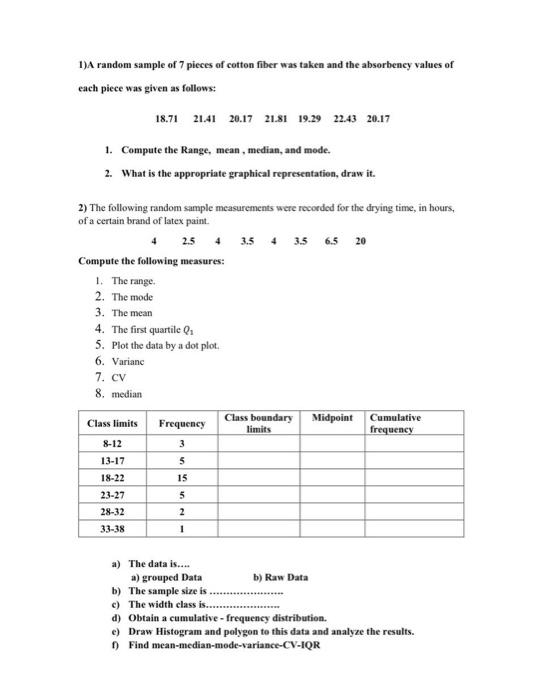
1)A random sample of 7 pieces of cotton fiber was taken and the absorbency values of each piece was given as follows: 18.71 21.41 20.17
Step by Step Solution
There are 3 Steps involved in it
Step: 1

Get Instant Access to Expert-Tailored Solutions
See step-by-step solutions with expert insights and AI powered tools for academic success
Step: 2

Step: 3
Ace Your Homework with AI
Get the answers you need in no time with our AI-driven, step-by-step assistance
Get Started
The Reward And Benefits Audit
Authors: Michael Armstrong
1st Edition
1907766081, 978-1907766084