Answered step by step
Verified Expert Solution
Question
1 Approved Answer
1.a The stock prices for Wal-Mart and Target are shown below for the start of each year since 2001. Calculate each year's percentage return
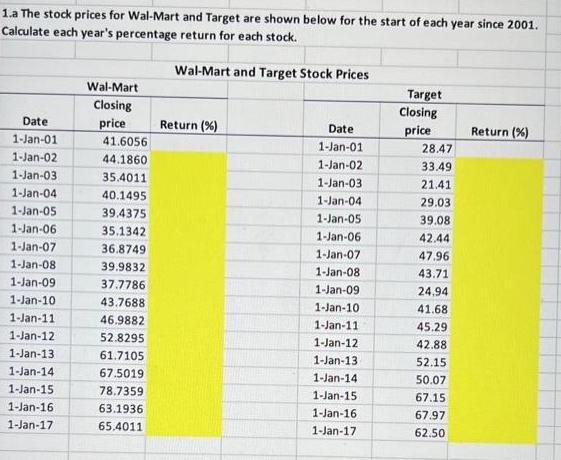
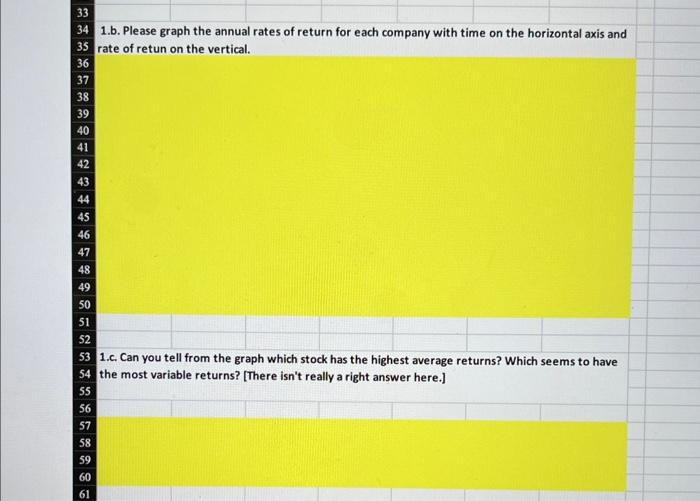
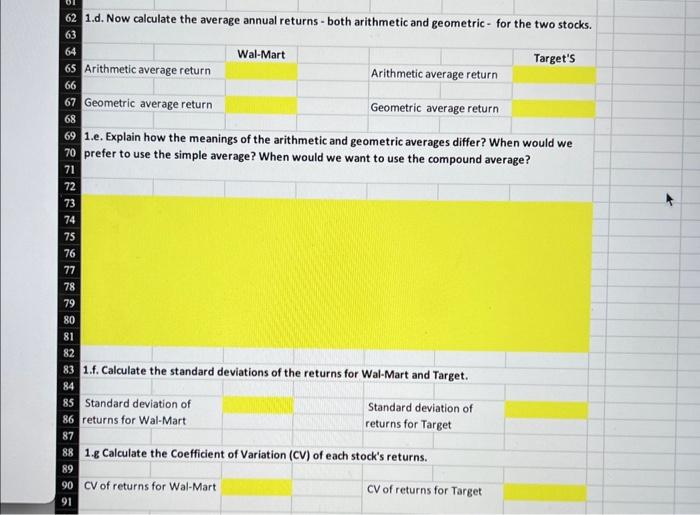
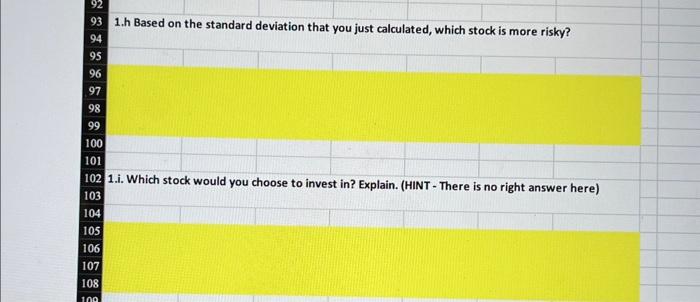
1.a The stock prices for Wal-Mart and Target are shown below for the start of each year since 2001. Calculate each year's percentage return for each stock. Wal-Mart and Target Stock Prices Date 1-Jan-01 1-Jan-02 1-Jan-03 1-Jan-04 1-Jan-05 1-Jan-06 1-Jan-07 1-Jan-08 1-Jan-09 1-Jan-10 1-Jan-11 1-Jan-12 1-Jan-13 1-Jan-14 1-Jan-15 1-Jan-16 1-Jan-17 Wal-Mart Closing price 41.6056 44.1860 35.4011 40.1495 39.4375 35.1342 36.8749 39.9832 37.7786 43.7688 46.9882 52.8295 61.7105 67.5019 78.7359 63.1936 65.4011 Return (%) Date 1-Jan-01 1-Jan-02 1-Jan-03 1-Jan-04 1-Jan-05 1-Jan-06 1-Jan-07 1-Jan-08 1-Jan-09 1-Jan-10 1-Jan-11 1-Jan-12 1-Jan-13 1-Jan-14 1-Jan-15 1-Jan-16 1-Jan-17 Target Closing price 28.47 33.49 21.41 29.03 39.08 42.44 47.96 43.71 24,94 41.68 45.29 42.88 52.15 50.07 67.15 67.97 62.50 Return (%) 33 34 1.b. Please graph the annual rates of return for each company with time on the horizontal axis and 35 rate of retun on the vertical. 36 37 38 39 40 41 42 43 44 45 46 47 48 49 50 51 52 53 1.c. Can you tell from the graph which stock has the highest average returns? Which seems to have 54 the most variable returns? [There isn't really a right answer here.] 55 56 57 58 59 60 61 62 1.d. Now calculate the average annual returns - both arithmetic and geometric for the two stocks. 63 64 65 Arithmetic average return 66 67 Geometric average return 68 Wal-Mart Arithmetic average return Geometric average return 69 1.e. Explain how the meanings of the arithmetic and geometric averages differ? When would we 70 prefer to use the simple average? When would we want to use the compound average? 71 72 73 74 75 76 77 78 79 80 81 82 83 1.f. Calculate the standard deviations of the returns for Wal-Mart and Target. 84 85 Standard deviation of 86 returns for Wal-Mart 87 88 1.g Calculate the Coefficient of Variation (CV) of each stock's returns. 89 90 CV of returns for Wal-Mart 91 Standard deviation of returns for Target Target's CV of returns for Target 92 93 1.h Based on the standard deviation that you just calculated, which stock is more risky? 94 95 96 97 98 99 100 101 102 1.i. Which stock would you choose to invest in? Explain. (HINT- There is no right answer here) 103 104 105 106 107 108 109
Step by Step Solution
★★★★★
3.52 Rating (152 Votes )
There are 3 Steps involved in it
Step: 1
1a Calculate the percentage returns for each year for Walmart and Target For Walmart 2002 Return 441860 416056416056 00583 583 2003 Return 354011 441860441860 01979 1979 2004 Return 401495 35401135401...
Get Instant Access to Expert-Tailored Solutions
See step-by-step solutions with expert insights and AI powered tools for academic success
Step: 2

Step: 3

Ace Your Homework with AI
Get the answers you need in no time with our AI-driven, step-by-step assistance
Get Started


