

Question
1.A travel magazine provided ratings for the top 10 small cruise ships. The data shown below are the scores each ship received based upon the
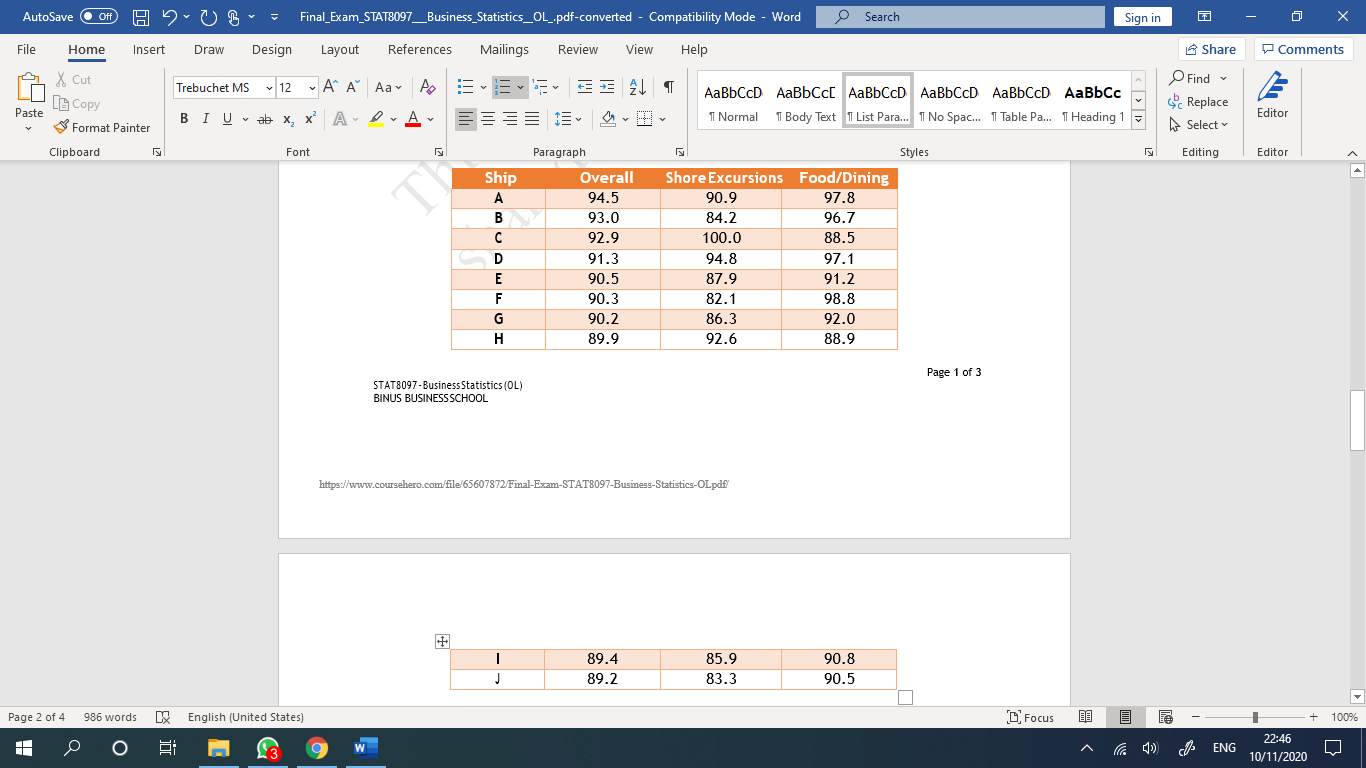
1.A travel magazine provided ratings for the top 10 small cruise ships. The data shown below are the scores each ship received based upon the results from their survey. Each score represents the percentage of respondents who rated a ship as excellent or very good on several criteria, including Shore Excursions and Food/Dining. An overall score was also reported and used to rank the ships.
a.Develop an estimated regression equation that can be used to predict the overall score, given the score for Shore Excursions.
b.Consider the addition of the independent variable Food/Dining. Develop the estimated regression that can be used to predict the overall score, given the scores for Shore Excursions and Food/Dining.
c.Predict the overall score for a cruise ship with a Shore Excursions score of 80 and a Food/Dining score of 90.
d.Based on R2 on the model in part (a) and (b), which model fits better?
e.Perform an F test for the model in part (b) using ? = 0.05. Is there significant relationship between overall score and all other scores?
f.Perform t tests for the model in part (b) using ? = 0.05. Are the independent variables significant? Should a variable be dropped from the model? Explain.
Step by Step Solution
There are 3 Steps involved in it
Step: 1

Get Instant Access to Expert-Tailored Solutions
See step-by-step solutions with expert insights and AI powered tools for academic success
Step: 2

Step: 3
Ace Your Homework with AI
Get the answers you need in no time with our AI-driven, step-by-step assistance
Get Started
Intro Stats
Authors: Richard D. De Veaux, Paul F. Velleman, David E. Bock
3rd edition
321533283, 321533289, 9780321463708, 9780321503848, 9780321503800, 9780321499431, 9780321499417, 978-0321500458