Answered step by step
Verified Expert Solution
Question
1 Approved Answer
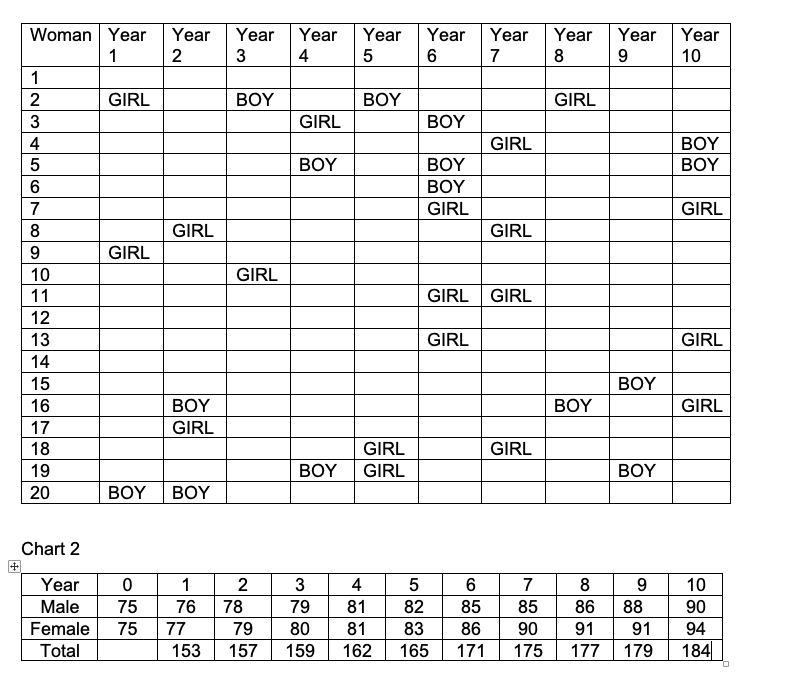
1.a. Use the first and last data points of the total population for each of the years from the Probability Island to find a linear
1.a. Use the first and last data points of the total population for each of the years from the Probability Island to find a linear equation to model the data.
b. Graph the equation.
c. Compare the slope of the Linear Regression Line of question 1 with the slope of this line.Provide an explanation of why they may similar or differ.
d. Use the equation to predict the population in year 20.

Step by Step Solution
There are 3 Steps involved in it
Step: 1

Get Instant Access to Expert-Tailored Solutions
See step-by-step solutions with expert insights and AI powered tools for academic success
Step: 2

Step: 3

Ace Your Homework with AI
Get the answers you need in no time with our AI-driven, step-by-step assistance
Get Started


