

Question
1.College debt versus adjusted in-state costs. Kiplinger's Best Values in Public Colleges provides a ranking of U.S. public colleges based on a combination of various
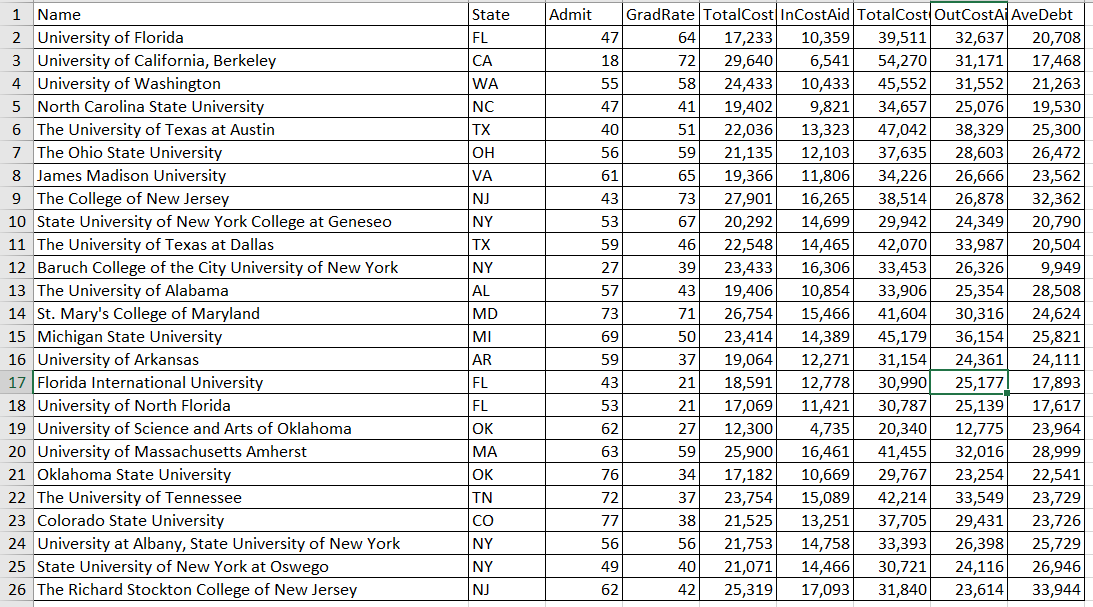
1.College debt versus adjusted in-state costs. Kiplinger's "Best Values in Public Colleges" provides a ranking of U.S. public colleges based on a combination of various measures of academics and affordability. Let's consider the average debt in dollars at graduation (AveDebt) as the response variable, and use Admit, GradRate, InCostAid, and OutCost Aid as the explanatory variables.
a)Write out the statistical model for this analysis.
b)Run the multiple regression model and specify the fitted regression equation.
c)Run the same multiple regression model as in b), but this time without Baruch College. Report the least-squares equation using all four variables.
d)What percent of the variability in average debt is explained by this model in c)?
e)Report the F statistics, its degrees of freedom, and the P-value. What do you conclude based on this test result?
Name State Admit GradRate TotalCostIn InCostAid TotalCostOut OutCostAid AveDebt University of Florida FL 47 64 17,233 10,359 39,511 32,637 20,708
University of California, Berkeley CA 18 72 29,640 6,541 54,270 31,171 17,468 University of Washington WA 55 58 24,433 10,433 45,552 31,552 21,263
North Carolina State University NC 47 41 19,402 9,821 34,657 25,076 19,530
The University of Texas at Austin TX 40 51 22,036 13,323 47,042 38,329 25,300
The Ohio State University OH 56 59 21,135 12,103 37,635 28,603 26,472
James Madison University VA 61 65 19,366 11,806 34,226 26,666 23,562
The College of New Jersey NJ 43 73 27,901 16,265 38,514 26,878 32,362
State University of New York College at Geneseo NY 53 67 20,292 14,699 29,942 24,349 20,790 The University of Texas at Dallas TX 59 46 22,548 14,465 42,070 33,987 20,504
Baruch College of the City University of New York NY 27 39 23,433 16,306 33,453 26,326 9,949 The University of Alabama AL 57 43 19,406 10,854 33,906 25,354 28,508
St. Mary's College of Maryland MD 73 71 26,754 15,466 41,604 30,316 24,624
Michigan State University MI 69 50 23,414 14,389 45,179 36,154 25,821
University of Arkansas AR 59 37 19,064 12,271 31,154 24,361 24,111
Florida International University FL 43 21 18,591 12,778 30,990 25,177 17,893
University of North Florida FL 53 21 17,069 11,421 30,787 25,139 17,617
University of Science and Arts of Oklahoma OK 62 27 12,300 4,735 20,340 12,775 23,964
University of Massachusetts Amherst MA 63 59 25,900 16,461 41,455 32,016 28,999
Oklahoma State University OK 76 34 17,182 10,669 29,767 23,254 22,541 The University of Tennessee TN 72 37 23,754 15,089 42,214 33,549 23,729
Colorado State University CO 77 38 21,525 13,251 37,705 29,431 23,726
University at Albany, State University of New York NY 56 56 21,753 14,758 33,393 26,398 25,729
State University of New York at Oswego NY 49 40 21,071 14,466 30,721 24,116 26,946
The Richard Stockton College of New Jersey NJ 62 42 25,319 17,093 31,840 23,614 33,944
Step by Step Solution
There are 3 Steps involved in it
Step: 1

Get Instant Access to Expert-Tailored Solutions
See step-by-step solutions with expert insights and AI powered tools for academic success
Step: 2

Step: 3
Ace Your Homework with AI
Get the answers you need in no time with our AI-driven, step-by-step assistance
Get Started
Fundamentals Of Business Mathematics In Canada
Authors: F. Ernest Jerome, Jackie Shemko
3rd Edition
1259370151, 978-1259370151