

Question
1.Consumer Reports tested 19 different brands and models of road, fitness, and comfort bikes. Road bikes are designed for long road trips; fitness bikes are
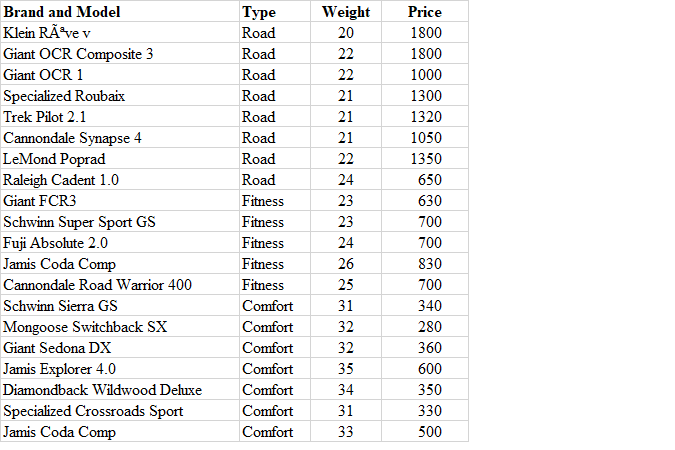
1.Consumer Reports tested 19 different brands and models of road, fitness, and comfort bikes. Road bikes are designed for long road trips; fitness bikes are designed for regular workouts or daily commuters; and comfort bikes are designed for leisure rides on typically flat roads. The data file Bikes show the type, weight (lb.), and price ($) for the 20 bicycles tested.
a.Develop an estimated regression equation that can be used to predict Price by using Type & Weight.
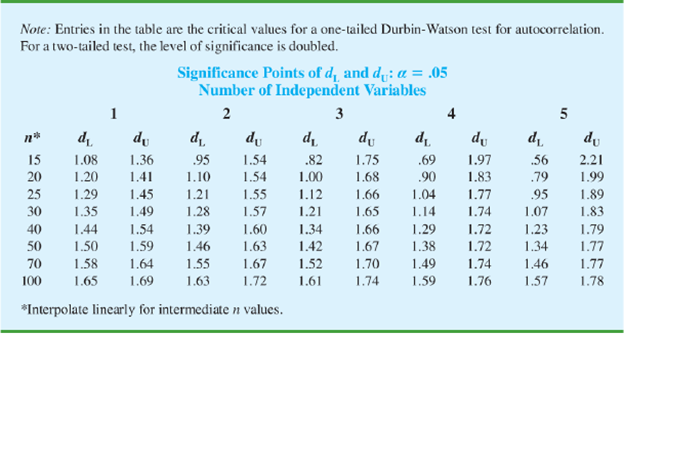
a.At the 0.05 level of significance, test for autocorrelation in the data.
Step by Step Solution
There are 3 Steps involved in it
Step: 1

Get Instant Access to Expert-Tailored Solutions
See step-by-step solutions with expert insights and AI powered tools for academic success
Step: 2

Step: 3
Ace Your Homework with AI
Get the answers you need in no time with our AI-driven, step-by-step assistance
Get Started
Mathematical Applications For The Management, Life And Social Sciences
Authors: Ronald J. Harshbarger, James J. Reynolds
12th Edition
978-1337625340