Question
1.Find the sample mean x, median, variance s2, and standard deviation s of the following data: 1510251240 2.Compute a 95% confidence interval for the true
1.Find the sample mean x, median, variance s2, and standard deviation s of the following data:
1510251240
2.Compute a 95% confidence interval for the true population mean if the sample mean x =15.3 cm with a sample size of10 ceramic vessels and a sample standard deviation s = 3.5 cm of ceramics vessels.
3.Let be normally distributed with a mean of 120 and standard deviation of 25.
(a)What is the Probability that X will be less than 160.
(b)Suppose a sample of 26 students were selected, what is the probability that X will be greater than 125.
4.The average body temperature of a healthy adult is = 98.6 (in degrees Fahrenheit). Jenny is concerned that her temperature is elevated, and so she took her temperature on 5 randomly chosen occasions. Her average temperature x was 99.3. Let be a random variable that represents Jenny's body temperature. You may assume that has a normal distribution with standard deviation = 0.73. Test, at the 1% level of significance, whether the sample result provides strong evidence that Jenny's body temperature of = 98.6 is elevated.
5.A recent poll of students in a certain college revealed the following information about their class scheduling:
STUDENTS
HISTORY
MATHEMATICS
BIOLOGY
TOTALS
FRESHMAN
20
45
5
70
JUNIOR
25
35
30
90
SENIOR
10
15
15
40
TOTALS
55
95
50
200
A student is selected at random, and the following variables are defined:
B: Biology, H: History, M: Mathematics,F: Freshman,J: Junior,S: Senior.
Find these probabilities:
(a) P(S/B)(b) P ( J and M)(c) P(S or M)(d) P(B /S )
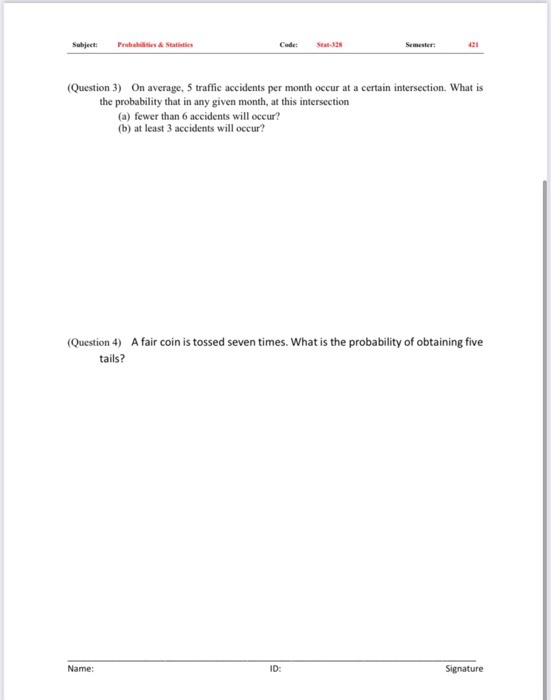
6.A coin is tossed 10 times.
(a)Find the probability of getting exactly 8 heads.
(Use the Binomial Probability Distribution table)
(b)Find the probability of getting at least 8 heads.
(c)Find the expected value ' '
(d)Find the standard deviation
7.An animal shelter has a 65% adoption rate for puppies. Of all the puppies in the shelter, 71%live to be 7 years older. Of all the puppies who lived to be 7 years older, 85% were adopted,
(a)What is the probability that a random selected puppy in the shelter will get adopted and lived 7 years older?
(b)Professor Jackson is in charge of a program to prepare people for a high school equivalency exam. Records show that 4.23% of the students need work in Math, 3.14% need work in English, and 2.03% need work in both areas. Compute the probability that a student selected at random needs Math or English.
8.A pair of dice is rolled, find these probabilities:
(a) P(sum is greater or equal to 10)
(b) P(sum is less than 6 )
(c) P(sum is 8 or 12 )
(d) P(sum is at most 5)
9.Draw the Normal Distribution Curve over the indicated area given and find these probabilities:
(a) Area between Z = -2.23 and Z = 2.33,
(b) Area to the right of Z - 3.45
10. From a deck of cards, a card is drawn. Find these probabilities:
(a)P(drawing a jack and red).
(b)P(drawing a spade giving that the card is black).
(c)P(drawing a diamond or black).
(d)P(drawing a jack and red).
(e)P(drawing a 10/ black).
Step by Step Solution
There are 3 Steps involved in it
Step: 1

Get Instant Access to Expert-Tailored Solutions
See step-by-step solutions with expert insights and AI powered tools for academic success
Step: 2

Step: 3

Ace Your Homework with AI
Get the answers you need in no time with our AI-driven, step-by-step assistance
Get Started


