

Question
1.For the population of people in the workforce in 1976, WAGE1 data was used to analyze how a person's wage is associated with observed education.
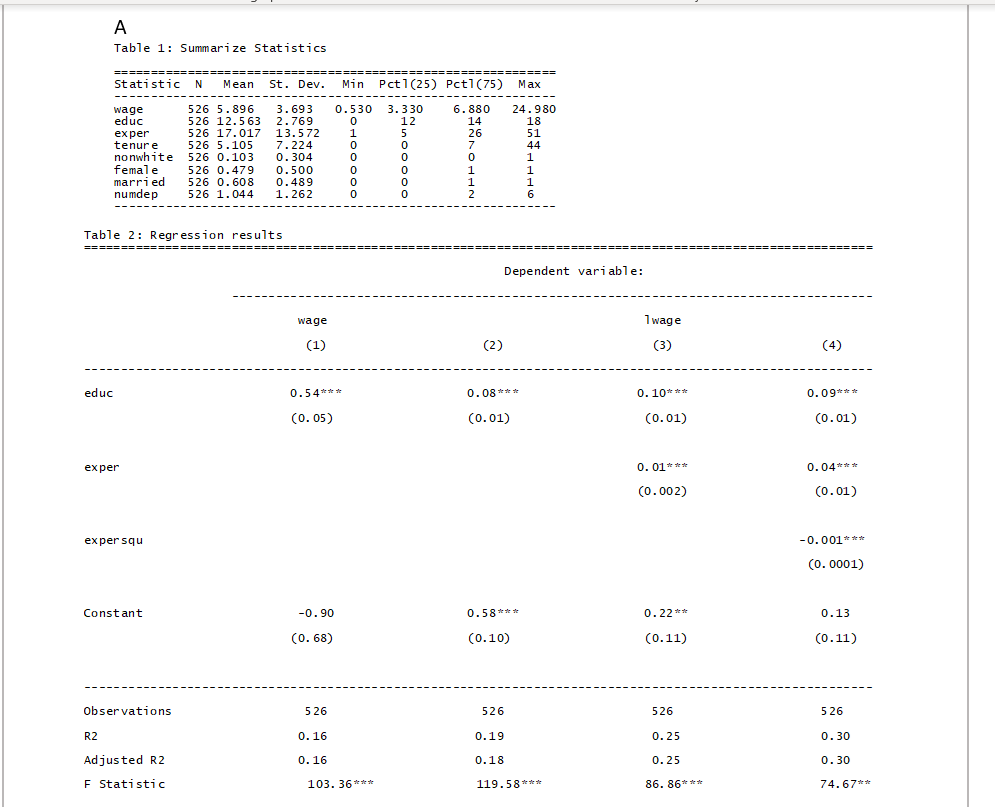
1.For the population of people in the workforce in 1976, WAGE1 data was used to analyze how a person's wage is associated with observed education. The table 1 list summarize statistics of the variables in the dataset. Table 2 reports the regression results from four different models, where column (1) is simple linear model with dependent variable wage, while column (2) -(4)use log wage as dependent variable.
How do you use the table to answer these questions and form the correct equations?
a. Make an estimated equation using column (1) information. Interpret the coefficient of education (educ). Is it significant?
b. Column (2) is different from column (1) in that we take the natural logarithm of wage
now. How do we interpret the coefficient of education now?
c.A person's working experience matters for his/her wage income. Therefore, we add
experience (exper) variable to the existing model: lwage = 0 + 1*EDUC + 2*Exper + u
Using this model to describe OLS methodology. Specifically, what are the decision variables? What is the objective function?
d. Column (3) reports the OLS results of the above model. Does experience have a significant impact on wage? If so, by how much?
e. Write the estimated equation using column (4) information. Using this estimated equation to calculate the impact of one more year working experience on wage.
f.Based on the regression results of four models in Table 2, which model do you prefer? Explain.
Step by Step Solution
There are 3 Steps involved in it
Step: 1

Get Instant Access to Expert-Tailored Solutions
See step-by-step solutions with expert insights and AI powered tools for academic success
Step: 2

Step: 3
Ace Your Homework with AI
Get the answers you need in no time with our AI-driven, step-by-step assistance
Get Started