Question
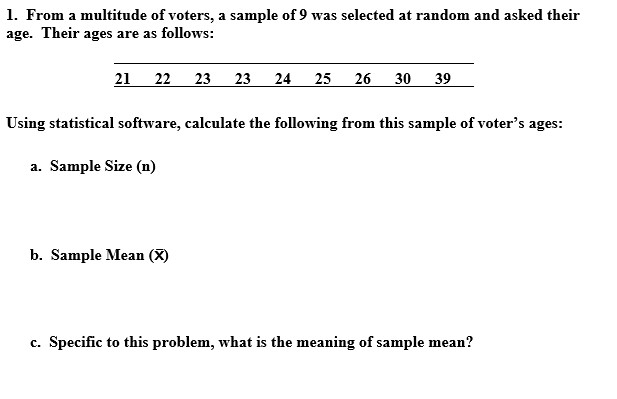
1.From a multitude of voters, a sample of 9 was selected at random and asked their age.Their ages are as follows: 21 22 23 23
1.From a multitude of voters, a sample of 9 was selected at random and asked their age.Their ages are as follows:
21
22
23
23
24
25
26
30
39
Using statistical software, calculate the following from this sample of voter's ages:
a.Sample Size (n)
b.Sample Mean (?)
c.Specific to this problem, what is the meaning of sample mean?
d.Median
e.Specific to this problem, what is the meaning of median?
f.Mode(s)
g.Range
h.Sample Variance (s2)
i.Sample Standard Deviation (s)
j.Specific to this problem what is the meaning of sample standard deviation?
k.5 Number-summary
Min =
Q1 =
Q2 =
Q3 =
Max =
l.IQR
m.Specific to this problem, what is the meaning of IQR?
n.Lower Limit
o.Upper limit
p.Are there any outliers in this data?If so, identify it (them).
q.Lower Adjacent Value
r.Upper Adjacent Value
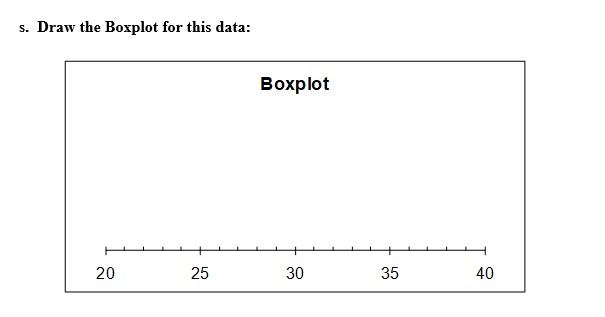
s.Draw the Boxplot for this data:
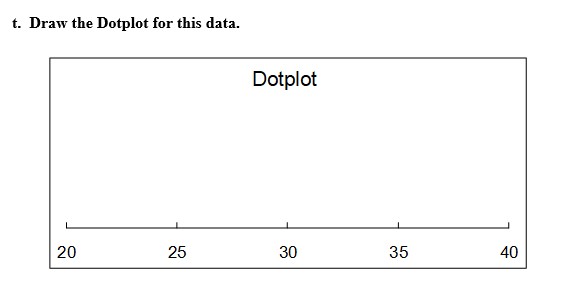
t.Draw the Dotplot for this data.
2.A recent newspaper article stated that the majority of college students voted for Joe Biden.A questioning statistics student believed that this estimate is low so she conducted her own study to see if the population proportion of students that voted for Joe Biden is greater than 60%.She took a simple random sample of 100 students and found that 67 of them actually voted for Joe Biden.Use statistics software and the following steps of the One Proportion z-Hypothesis Test Procedure with a 0.05 level of significance, ?, to test the hypothesis that more than 60% of students voted for Joe Biden.Note: x = 67 and n = 100.
a.Determine whether both assumptions are met:
Assumption 1:Simple random sample?
Assumption 2:Both np and nq are 10 or greater
Are both assumptions met?
Even if you do not think the assumptions are met, please proceed with the following steps of the One Proportion z-Hypothesis Test Procedure.
b.Step 1State the null and alternative hypotheses.Is this hypothesis test left tailed, two tailed or right tailed?
H0:
HA:
Tail:
c.Step 2Decide on the significance level, ?.
d.Step 3Use statistical software to find the value of the test statistic.
e.Step 4Use statistical software to find the P-value.
f.Step 5Reject H0 or do not reject H0?Why?That is, explain your reasoning.
g.Step 6Interpret the results of the hypothesis.
h.Based on this analysis, did over 60% of all students vote for Joe Biden?Explain your reasoning.
3.Using the same sample data from Problem #2 (67 out of 100 students voted for Joe Biden) and statistics software to perform a One-Proportion z?Interval Procedure to determine the 90% confidence interval for the population proportion, p, of all college students that voted for Joe Biden.
a.Determine whether both assumptions are met:
Assumption 1:Simple random sample?
Assumption 2:Both np and nq are 10 or greater
Are both assumptions met?
Even if you do not think the assumptions are met, please proceed with the following steps for the One Proportion z-Interval Procedure for a population proportion.
b.Step 1Use statistical software to find z?/2
c.Step 2Use statistical software to find the confidence interval for the population proportion.
d.Step 3Interpret the confidence interval
e.Based on this confidence interval, does this informal test support the same conclusion as the formal results of the hypothesis test of Problem #2?Fully explain your answer.
4.Using the statistics from Problem #1 about the age of voters (? = 25.8889, s = 5.5777 and n = 9), test the hypothesis that the population mean age of all voters is greater than 21.Assume the data is from a simple random sample from a normal population and use the following steps of the One Mean t-Hypothesis Test Procedure with a 0.05 level of significance, ?.
a.Determine whether all 3 assumptions are met:
Assumption 1:Simple random sample?
Assumption 2:Normal population or large sample size?
Assumption 3:? unknown?
Are all 3 assumptions met?
Even if you do not think the assumptions are met, please proceed with the following steps of the One Mean t-Hypothesis Test Procedure.
b.Step 1State the null and alternative hypotheses.Is this hypothesis test left tailed, two tailed or right tailed?
H0:
HA:
Tail:
c.Step 2Decide on the significance level, ?.
d.Step 3Find the value of the test statistic.
e.Step 4Use statistical software to find the P-value.
f.Step 5Reject H0 or do not reject H0?Why?That is, explain your reasoning.
g.Step 6Interpret the results of the hypothesis.
h.Based on this analysis, is the population mean age of all voters greater than 21?Explain your reasoning.
5.Using the same sample data from Problems #1 and #4 (? = 25.8889 days, s = 5.5777 days and n = 9), follow the steps of the One Mean t-Interval Procedure to determine the 90% confidence interval for the population mean age of all voters.Assume a simple random sample from a normal population.
a.Determine whether all 3 assumptions are met:
Assumption 1:Simple random sample?
Assumption 2:Normal population or large sample size?
Assumption 3:? unknown?
Are all 3 assumptions met?
Even if you do not think the assumptions are met, please proceed with the following steps for the One-Sample t-Interval Procedure for a population mean.
b.Step 1For a confidence level of 1 - ?, find t?/2
c.Step 2Find the confidence interval for the population mean.
d.Step 3Interpret the confidence interval
e.Based on your confidence interval, does this informal test support the same conclusion as the formal results of the hypothesis test of Problem #4.If so, why and if not, why not?
6.Are democrats more likely to vote than republicans?Independent data was obtained from simple random samples from voters throughout the state.For democrats, there were 450 out of 800 that voted and for republicans, there were 375 out of 700 that voted.Use the following steps of the Two Proportion z-Hypothesis Test with a 0.05 level of significance, ?, to test the claim (hypothesis) that democrats are more likely to vote than republicans.(Note: x1 = 450, n1 = 800, x2 = 375 and n2 = 700)
a.Determine whether the assumptions are met:
Assumption 1:Simple random sample?
Assumption 2:Independent samples?
Assumption 3: Are the number of successes and the number of failures 10 or greater for both samples?
Are all three assumptions met?
Even if you do not think the assumptions are met, please proceed with the following steps of the Two Proportion z-Hypothesis Test Procedure.
b.Step 1State the null and alternative hypotheses.Is this hypothesis test left tailed, two tailed or right tailed?
H0:
HA:
Tail:
c.Step 2Decide on the significance level, ?.
d.Step 3Find the value of the test statistic.
e.Step 4Use statistical software to find the P-value.
f.Step 5Reject H0 or do not reject H0?Why?That is, explain your reasoning.
g.Step 6Interpret the results of the hypothesis.
h.Based on this analysis, are democrats more likely than republicans to vote?Explain your reasoning.
7.Using the same sample data from Problem #6 (450 out of 800 democrats and 375 out of 700 republicans) to perform a Two-Proportion z-Interval Procedure to determine the 90% confidence interval for the difference between the two population proportion of democrats and republicans that voted.Note: x1 = 450, n1 = 800, x2 = 375 and n2 = 700)
a.Determine whether the assumptions are met:
Assumption 1:Simple random sample?
Assumption 2:Independent samples?
Assumption 3: Are the number of successes and the number of failures 10 or greater for both samples?
Are all three assumptions met?
Even if you do not think the assumptions are met, please proceed with the following steps for the Two Proportion z-Interval Procedure for a population proportion.
b.Step 1For a confidence level of 1 - ?, find z?/2
c.Step 2Find the confidence interval for the difference of two population proportions.
d.Step 3Interpret the confidence interval
e.Based on your confidence interval, does this confidence interval support the same conclusion as the formal results of the hypothesis test of Problem #6?If so, why and if not, why not?
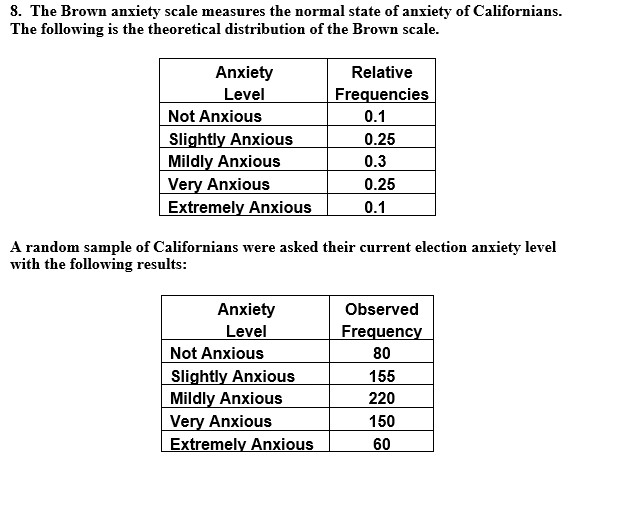
8.The Brown anxiety scale measures the normal state of anxiety of Californians. The following is the theoretical distribution of the Brown scale.
Anxiety
Level
Relative
Frequencies
Not Anxious
0.1
Slightly Anxious
0.25
Mildly Anxious
0.3
Very Anxious
0.25
Extremely Anxious
0.1
A random sample of Californians were asked their current election anxiety level with the following results:
Anxiety
Level
Observed
Frequency
Not Anxious
80
Slightly Anxious
155
Mildly Anxious
220
Very Anxious
150
Extremely Anxious
60
Do the data provide sufficient evidence to conclude that Californians are feeling normal election anxiety levels (matching the Brown anxiety distribution) or are Californians feeling abnormal anxiety levels (not matching the Brown distribution)?
Use the following steps of the Chi-Square Goodness-of-Fit Test with a 0.05 level of significance, ?, to test the hypothesis that Californians are feeling abnormal election anxiety levels (not matching the Brown distribution).
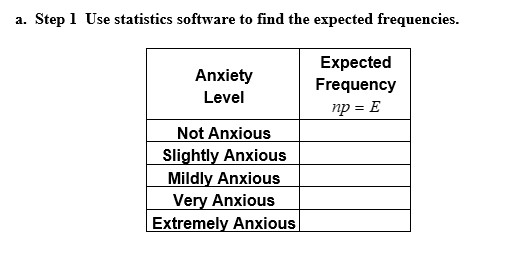
a.Step 1Use statistics software to find the expected frequencies.
Anxiety
Level
Expected
Frequency
Not Anxious
Slightly Anxious
Mildly Anxious
Very Anxious
Extremely Anxious
b.Step 2Assumptions
Assumption 1:Is the data randomly collected?
Assumption 2:Are all expected frequencies 5 or greater?
Are both assumptions met?
Even if you do not think the assumptions are met, please proceed with the following steps for the Chi-Square Goodness-of-Fit test.
c.Step 3State the null and alternative hypotheses:
H0:
HA:
d.Step 4Decide on the significance level, ?.
e.Step 5Use statistics software to find the value of the test statistic.
f.Step 6Use statistics software to find P-value.
g.Step 7Reject H0 or do not reject H0?Why?That is, explain your reasoning.
h.Step 8Interpret the results of the hypothesis.
i.Based on your results from the above hypothesis test, is the election anxiety level of Californians normal (matching the Brown distribution)?Please explain your answer.
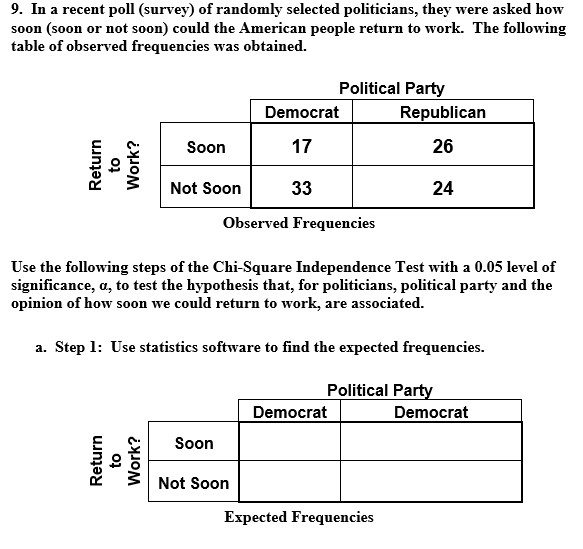
9.In a recent poll (survey) of randomly selected politicians, they were asked how soon (soon or not soon) could the American people return to work.The following table of observed frequencies was obtained.
Political Party
Democrat
Republican
Return to Work?
Soon
17
26
Not Soon
33
24
Observed Frequencies
Use the following steps of the Chi-Square Independence Test with a 0.05 level of significance, ?, to test the hypothesis that, for politicians, political party and the opinion of how soon we could return to work, are associated.
a.Step 1:Use statistics software to find the expected frequencies.
Political Party
Democrat
Democrat
Return to Work?
Soon
Not Soon
Expected Frequencies
b.Step 2:Are the assumption met?
Assumption 1:Is the data randomly collected?
Assumption 2:Are all expected frequencies 5 or greater?
`
Are both assumptions met?
Even if you do not think the assumptions are met, please proceed with the following steps for the Chi-Square Independence test.
c.Step 3:State the null and alternative hypotheses:
H0:
Ha:
d.Step 4:Decide on the significance level, ?
e.Step 5:Use statistics software to find the value of the Chi-square test statistic.
f.Step 6:Use statistics software to find P-value.
g. Step 7:Reject H0 or do not reject H0?Explain your reasoning (why).
i.Step 8:Interpret the results of the hypothesis
j.Based on your results, is political party and the opinion of how soon the American people could return to work, associated?Explain your answer.
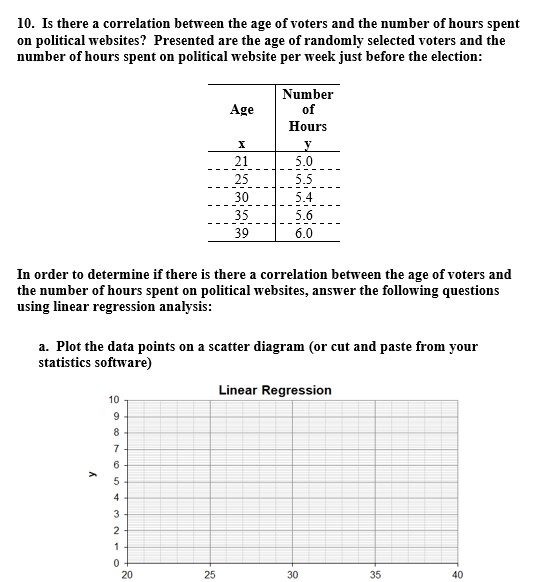
10.Is there a correlation between the age of voters and the number of hours spent on political websites?Presented are the age of randomly selected voters and the number of hours spent on political website per week just before the election:
Age
Number of
Hours
x
y
21
5.0
25
5.5
30
5.4
35
5.6
39
6.0
In order to determine if there is there a correlation between the age of voters and the number of hours spent on political websites, answer the following questions using linear regression analysis:
a.Plot the data points on a scatter diagram (or cut and paste from your statistics software)
b.Does this set of data points look like a candidate for linear regression?Please explain your answer.
c.Use statistical software to find the equation of the regression line that best fits this set of data points according to the least squares criterion?
d.Because grossly incorrect predictions can result from extrapolation, to what range of observed values of the predictor variable, day (x), should this regression line be limited in order to linearly estimate the response variable, number of hours per week spent on political websites (y)?
e.Explain the meaning of b0.
f.Explain the meaning of b1.
g.Using the regression equation from Part c, estimate the number of hours spent on political websites for a 21 year-old voter (x = 21).
h.Using the regression equation from Part c, estimate the number of hours spend on political websites for a 39 year-old voter(x = 39)
i.On the same graph that you plotted the data points (above), draw the regression line by connecting the points you just found in Parts (g) and (h) and extending it in both directions to the limits you found in part (d) or cut and paste from your statistics software.
j.Use statistics software to find the Correlation Coefficient, r
k.Use statistics software to find the Coefficient of Determination, r2
l.Explain the meaning of r2.
m.Is the regression line from Part c useful for making predictions of the response variable, number of hours spent on political websites, y?Explain your answer.
Step by Step Solution
There are 3 Steps involved in it
Step: 1

Get Instant Access to Expert-Tailored Solutions
See step-by-step solutions with expert insights and AI powered tools for academic success
Step: 2

Step: 3

Ace Your Homework with AI
Get the answers you need in no time with our AI-driven, step-by-step assistance
Get Started


