

Question
1.Has the globe been becoming warmer and drier over 1950-2000? Draw evidence on the descriptive statistics of relevant variables in the dataset. 2.Do hot countries
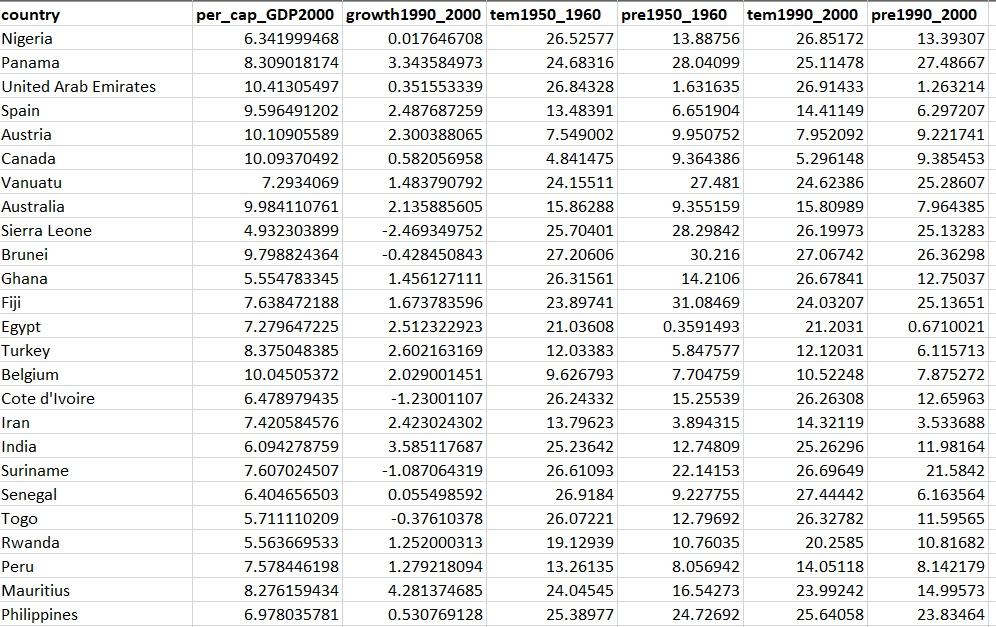
1.Has the globe been becoming warmer and drier over 1950-2000? Draw evidence on the descriptive statistics of relevant variables in the dataset.
2.Do hot countries tend to be poor (with lower per capita GDP)? Do dry countries tend to be poor? Use appropriate graphs to interpret the relationship between relevant variables. You only need to present tworelationships. Carefully interpret and explain.
3.Calculate the sample covariance and correlation for the two relationships in question 2 above using Data Analysis Tool Pack or Excel statistical functions. In addition, you are required to calculate the sample covariance and correlation using a second method (using basic Excel formulae without Data Analysis Tool Pack). The calculations by the second method should be carefully laid out in Excel and should NOT use any hard-wired Excel statistical functions e.g. COVARIANCE.S, CORREL, et al. You can use the Excel sort command, the sum command, and any other non-statistical excel commands. Carefully interpret your results.
Step by Step Solution
There are 3 Steps involved in it
Step: 1

Get Instant Access to Expert-Tailored Solutions
See step-by-step solutions with expert insights and AI powered tools for academic success
Step: 2

Step: 3
Ace Your Homework with AI
Get the answers you need in no time with our AI-driven, step-by-step assistance
Get Started
Calculus I With Integrated Precalculus
Authors: Laura Taalman
1st Edition
1464153027, 9781464153020