

Question
1.Imagine now that 25 students from STAT 1350 each take a random sample of n = 25 Reese's Pieces candies from the same population of
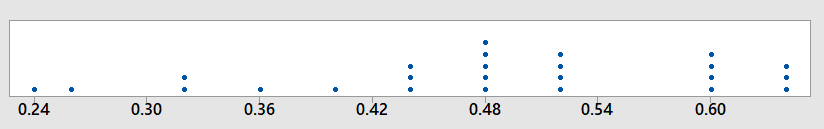
1.Imagine now that 25 students from STAT 1350 each take a random sample ofn= 25 Reese's Pieces candies from the same population of candies.Each student then determines the proportion of orange candies in their sample.The graph below?called a dot plot?shows each of these sample proportions.Each proportion appears as a dot above a number line, and the number line gives us different values of our sample proportions.If any dots are stacked in a column, it would mean that more than one student obtained that same sample proportion.For example, there are five dots stacked in a column at 0.48, and this means that five students obtained a sample proportion of 0.48.
Step by Step Solution
There are 3 Steps involved in it
Step: 1

Get Instant Access to Expert-Tailored Solutions
See step-by-step solutions with expert insights and AI powered tools for academic success
Step: 2

Step: 3
Ace Your Homework with AI
Get the answers you need in no time with our AI-driven, step-by-step assistance
Get Started
Fundamentals Of Business Mathematics In Canada
Authors: F. Ernest Jerome, Jackie Shemko
3rd Edition
1259370151, 978-1259370151