

Question
1.In the graph below assume that a $1 tax is paid by lumber mills (so it shifts the supply curve rather than the demand curve).
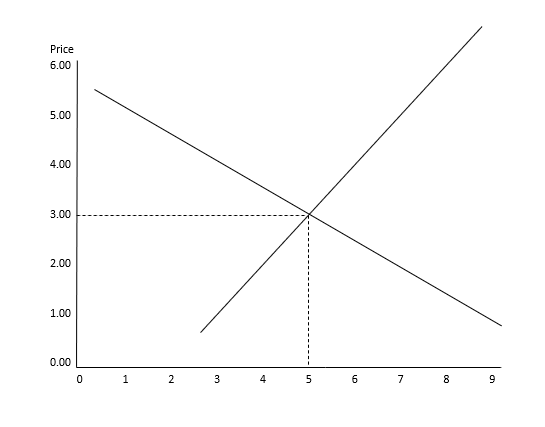
1.In the graph below assume that a $1 tax is paid by lumber mills (so it shifts the supply curve rather than the demand curve). The graph below represents the situation prior to the introduction of the tax.
a.Show a) how the supply curve would be affected, b) what would be the change in producer surplus, c) what would be the change in the consumer surplus, d) what would be the revenue from the tax, and d) what would be the deadweight loss (DWL).
(Indicate the different areas by labeling the corners (abc), you may also shade the areas as long as your answer is clear.
b. If farm prices drop, so that many farms in the region go broke and shut down, how might this affect the supply curve below? Explain why this might occur.
Step by Step Solution
There are 3 Steps involved in it
Step: 1

Get Instant Access to Expert-Tailored Solutions
See step-by-step solutions with expert insights and AI powered tools for academic success
Step: 2

Step: 3
Ace Your Homework with AI
Get the answers you need in no time with our AI-driven, step-by-step assistance
Get Started
Managerial economics
Authors: william f. samuelson stephen g. marks
7th edition
9781118214183, 1118041585, 1118214188, 978-1118041581