1In which year did MSFT have a better liquidity position?
A. Q1
B. Q2
C. Q3
D. Data not provided is not enough
2In which year did MSFT have a better leveraging position?
A. Q1
B. Q2
C. Q3
D. Data not provided is not enough
3In which year did MSFT have a better profitability position?
A. Q1
B. Q2
C. Q3
D. Data not provided is not enough
4In which year did MSFT have a better total asset management efficiency position?
A. Q1
B. Q2
C. Q3
D. Data not provided is not enough
5In which year did MSFT have a better cash flow position?
A. Q1
B. Q2
C. Q3
D. Data not provided is not enough
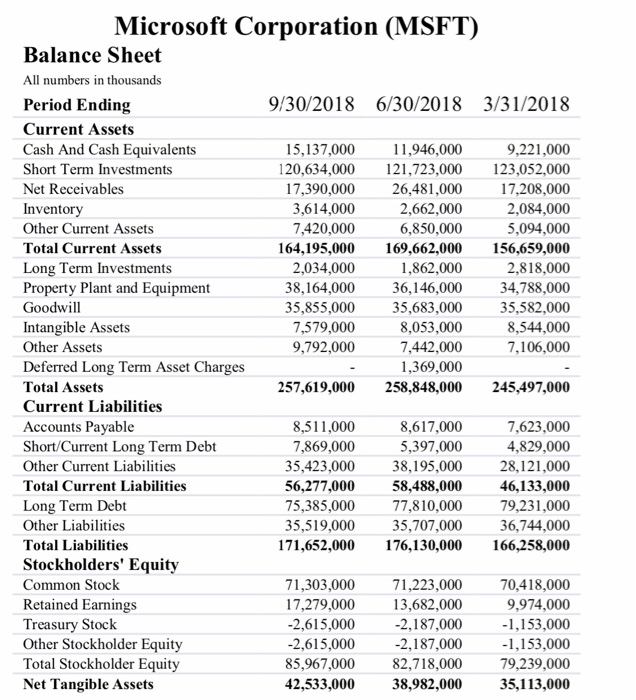
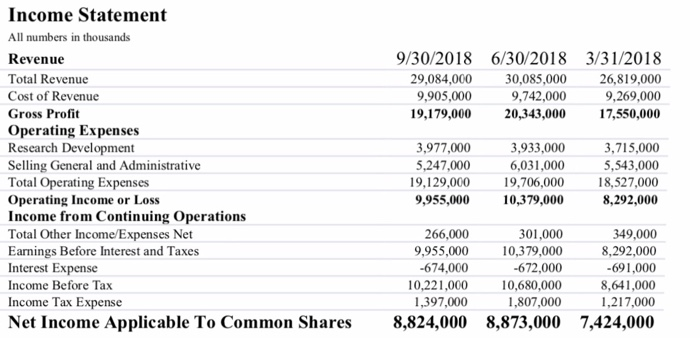
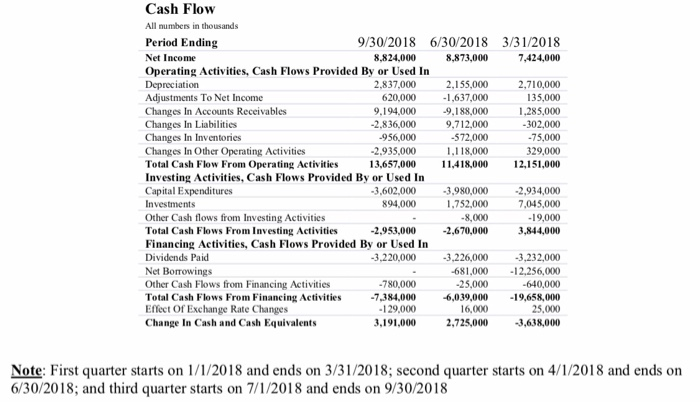
Microsoft Corporation (MSFT) Balance Sheet All numbers in thousands 9/30/2018 6/30/2018 3/31/2018 Period Ending Current Assets Cash And Cash Equivalents Short Term Investments Net Receivables Inventory Other Current Assets Total Current Assets Long Term Investments Property Plant and Equipment Goodwill Intangible Assets Other Assets Deferred Long Term Asset Charges Total Assets Current Liabilities Accounts Payable Short/Current Long Term Debt Other Current Liabilities Total Current Liabilities Long Term Debt Other Liabilities Total Liabilities Stockholders' Equity Common Stock Retained Earnings Treasury Stock Other Stockholder Equity Total Stockholder Equity Net Tangible Assets 9,221,000 120,634,000 21,723,000 123,052,000 17,390,000 26,481,000 17,208,000 2,084,000 5,094,000 164,195,000 169,662,000156,659,000 2,818,000 34,788,000 35,582,000 8,544,000 7,106,000 15,137,000 11,946,000 3,614,000 7,420,000 2,662,000 6,850,000 2,034,000 38,164,000 35,855,000 7,579,000 9,792,000 1,862,000 36,146,000 35,683,000 8,053,000 7,442,000 1,369,000 257,619,000 258,848,000 245,497,000 7,623,000 4,829,000 35,423,000 38,195,000 28,121,000 56,277,00058,488,000 46,133,000 75,385,000 77,810,000 79,231,000 35,519,00035,707,000 36,744,000 171,652,000 176,130,000 166,258,000 8,5 I 1,000 7,869,000 8,617,000 5,397,000 71,303,000 71,223,000 70,418,000 9,974,000 -2,187,0001,153,000 1,153,000 85,967,000 82,718,000 79,239,000 42,533.00038,982,000 35,113,000 17,279,00013,682,000 2,615,000 -2,615,000 2,187,000 Income Statement All numbers in thousands Revenue Total Revenue Cost of Revenue Gross Profit Operating Expenses Research Development Selling General and Administrative Total Operating Expenses Operating Income or Loss Income from Continuing Operations Total Other Income/Expenses Net Earnings Before Interest and Taxes Interest Expense Income Before Tax Income Tax Expense 9/30/2018 6/30/2018 3/31/2018 29,084,000 30,085,00026,819,000 9,742,000 20,343.000 9,905,000 19,179,000 9,269,000 17,550,000 3,977,000 ,247,000 19,129,000 9,955,000 3,715,000 5,543,000 19,706,00018,527,000 8,292,000 3,933,000 6,031,000 10,379,000 266,000 9,955,000 -674,000 10,221,000 1,397,000 301,000 10,379,000 672,000 10,680,000 1,807,000 349,000 8,292,000 691,000 8,641,000 1,217,000 7,424,000 Net Income Applicable To Common Shares8,824,000 8,873,000 Cash Flow All numbers in thousands 9/30/2018 6/30/2018 3/31/2018 7,424,000 Period Ending Net Income Operating Activities, Cash Flows Provided By or Used In Depreciation Adjustments To Net Income Changes In Accounts Receivables Changes In Liabilities Changes In Inventories Changes In Other Operating Activities Total Cash Flow From Operating Activities Investing Activities, Cash Flows Provided By or Used In Capital Expenditures Investments Other Cash flows from Investing Activities Total Cash Flows From Investing Activities Financing Activities, Cash Flows Provided By or Used In Dividends Paid Net Borrowings Other Cash Flows from Financing Activities Total Cash Flows From Financing Activities Effect Of Exchange Rate Changes Change In Cash and Cash Equivalents 8,824,000 8,873,00O 2,710,000 135,000 1.285,000 302,000 75,000 329,000 13,657,000 1,418000 12,151,000 2,837,000 2.155,000 620,000 1.637,000 -9188,000 9,712,000 572,000 1.118,000 9,194,000 2,836,000 956,000 2.935,000 3,602,000 3,980,0002,934,000 7,045,000 19,000 3,844,000 1,752,000 -8,000 2,953,0002,670,000 894,000 3,220,000 3,226,000 3.232,000 681,000-12,256,000 -640,000 7.384,000 6,039,000 19,658,000 25,000 2,725,000 3.638,000 780,000 -25,000 129,000 3,191,000 16,000 Note: First quarter starts on 1/1/2018 and ends on 3/31/2018; second quarter starts on 4/1/2018 and ends on 6/30/2018; and third quarter starts on 7/1/2018 and ends on 9/30/2018