Answered step by step
Verified Expert Solution
Question
1 Approved Answer
1.Load Iris data, you can pass the command datairis) or type data (and scroll through to find the iris data and then press enter. Draw
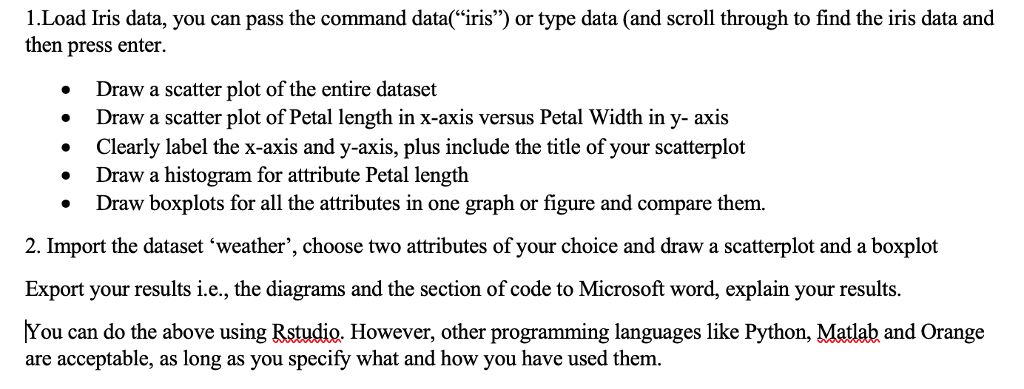
1.Load Iris data, you can pass the command data"iris") or type data (and scroll through to find the iris data and then press enter. Draw a scatter plot of the entire dataset Draw a scatter plot of Petal length in x-axis versus Petal Width in y- axis .Clearly label the x-axis and y-axis, plus include the title of your scatterplot . Draw a histogram for attribute Petal length . Draw boxplots for all the attributes in one graph or figure and compare them 2. Import the dataset weather', choose two attributes of your choice and draw a scatterplot and a boxplot Export your results i.e., the diagrams and the section of code to Microsoft word, explain your results. You can do the above using Rstudio. However, other programming languages like Python, Matlab and Orange are acceptable, as long as you specify what and how you have used them
Step by Step Solution
There are 3 Steps involved in it
Step: 1
Get Instant Access to Expert-Tailored Solutions
See step-by-step solutions with expert insights and AI powered tools for academic success
Step: 2
Step: 3
Ace Your Homework with AI
Get the answers you need in no time with our AI-driven, step-by-step assistance
Get Started